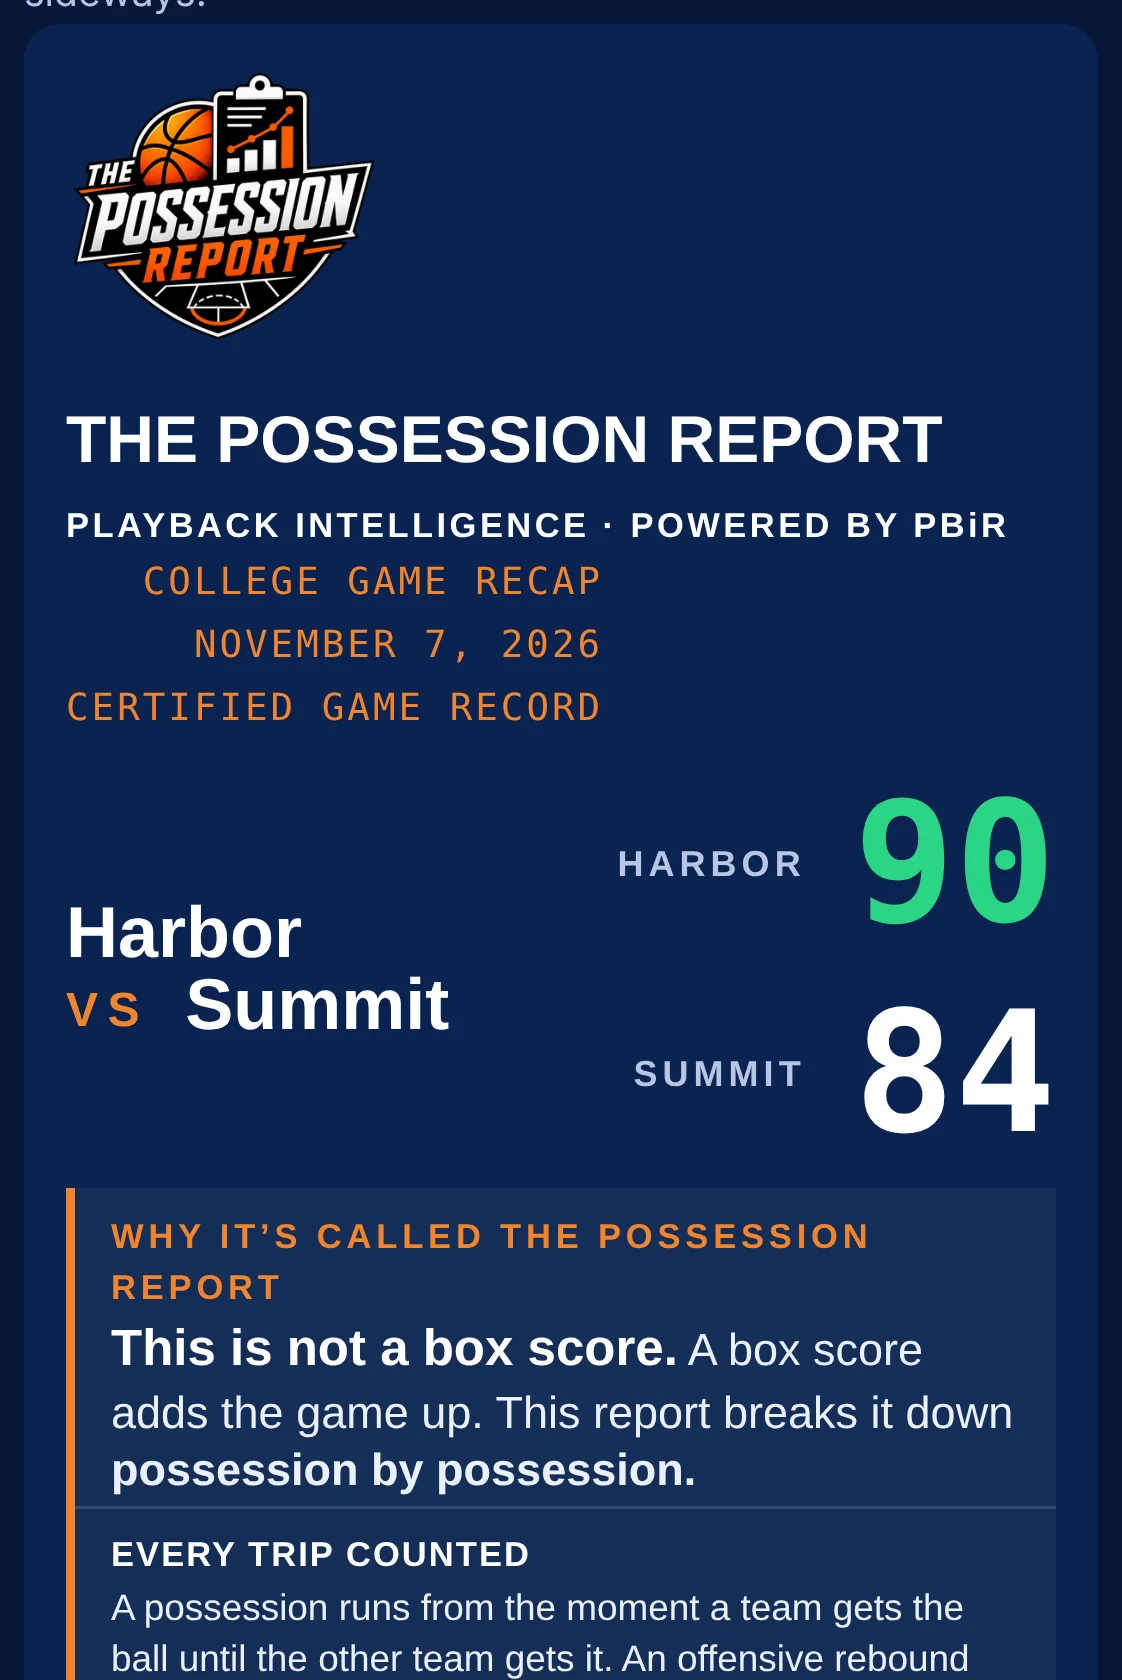
The interactive Game Recap.
EVERY GAME. EVERY POSSESSION. EVERY PLAYER.
A sample game: the team and player names are made up. Harbor won at Summit, 90 to 84.
Every number you are about to see is counted from the official play-by-play. Here is how a coach uses it.
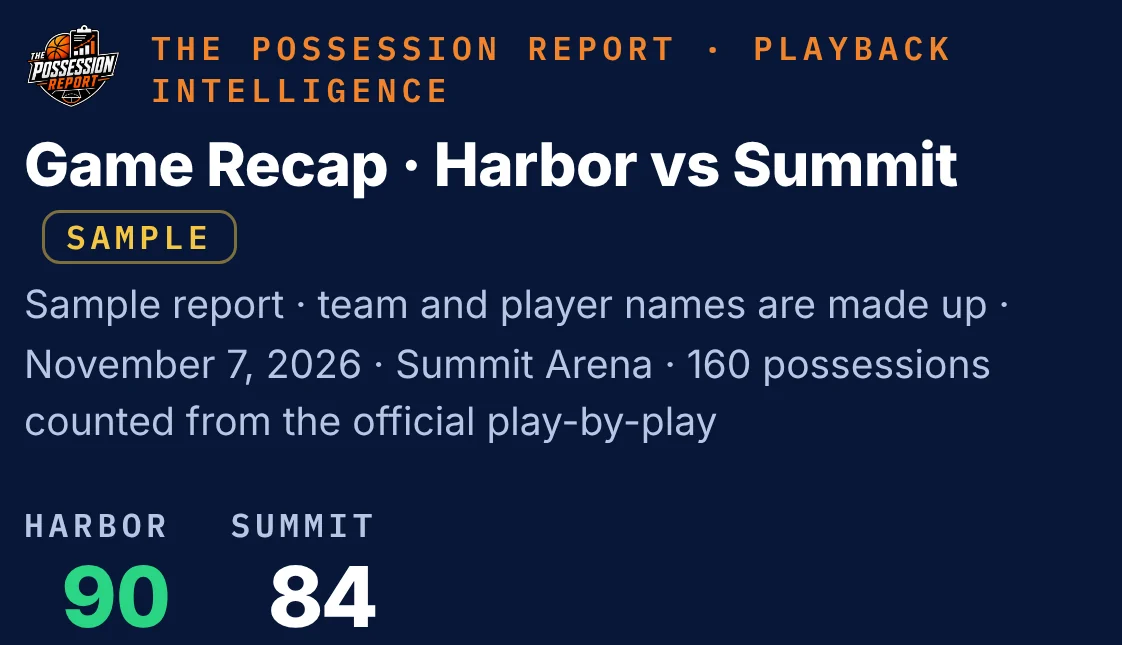
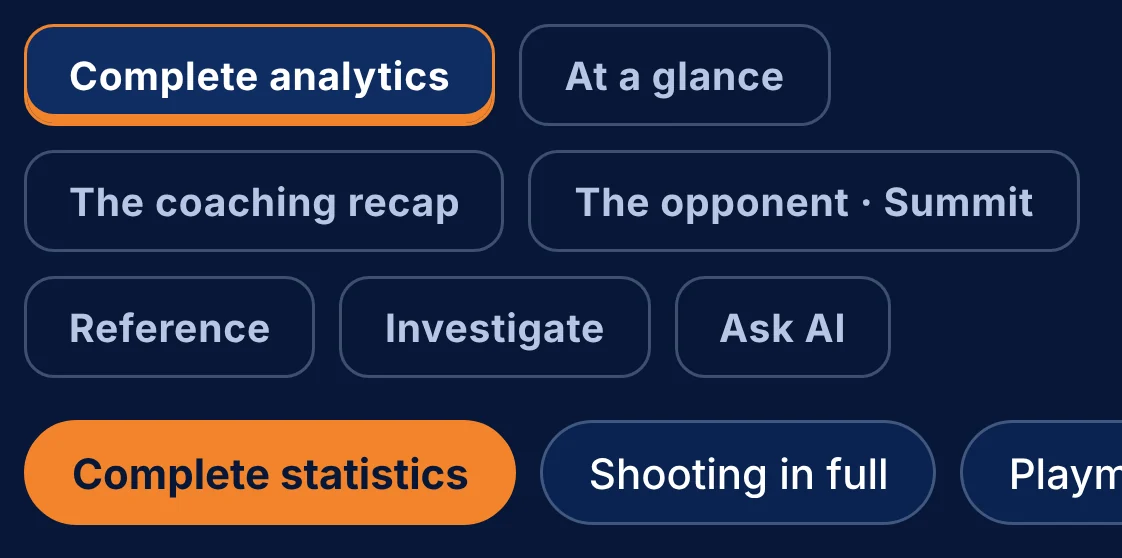
Tap a part. Tap a section. That report opens.
No scrolling through sixty pages to find it.
Complete analytics opens first; then at a glance, the coaching recap, the opponent, reference, investigate and Ask AI: every part of the report has its own tab.
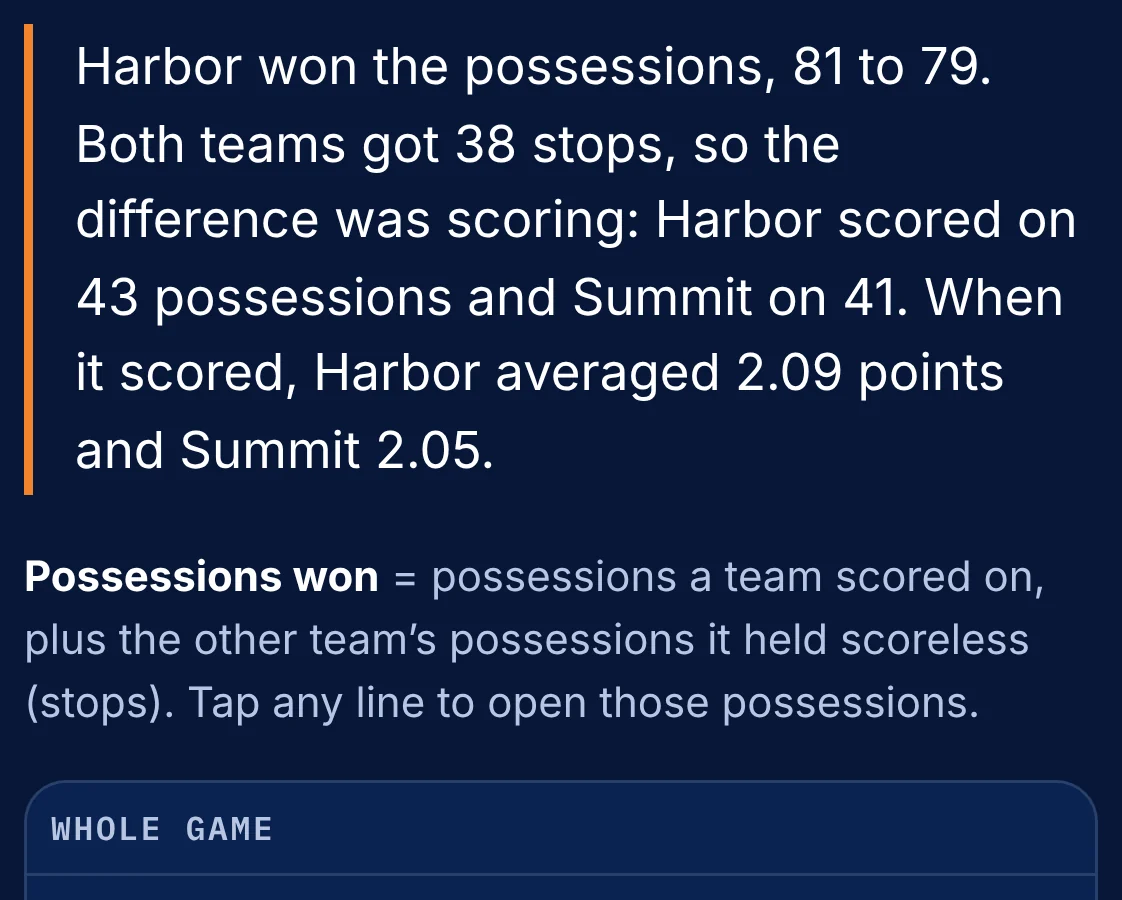
Every section starts with the finding, in one sentence.
Harbor won the possessions, 81 to 79.
Both teams got 38 stops, so the difference was scoring: Harbor scored on 43 possessions, Summit on 41.
Tap a half. Every number on the screen changes with it.
That is where this game turned.
First half: Summit won the possessions, 46 to 37. Second half: Harbor won them, 44 to 33.
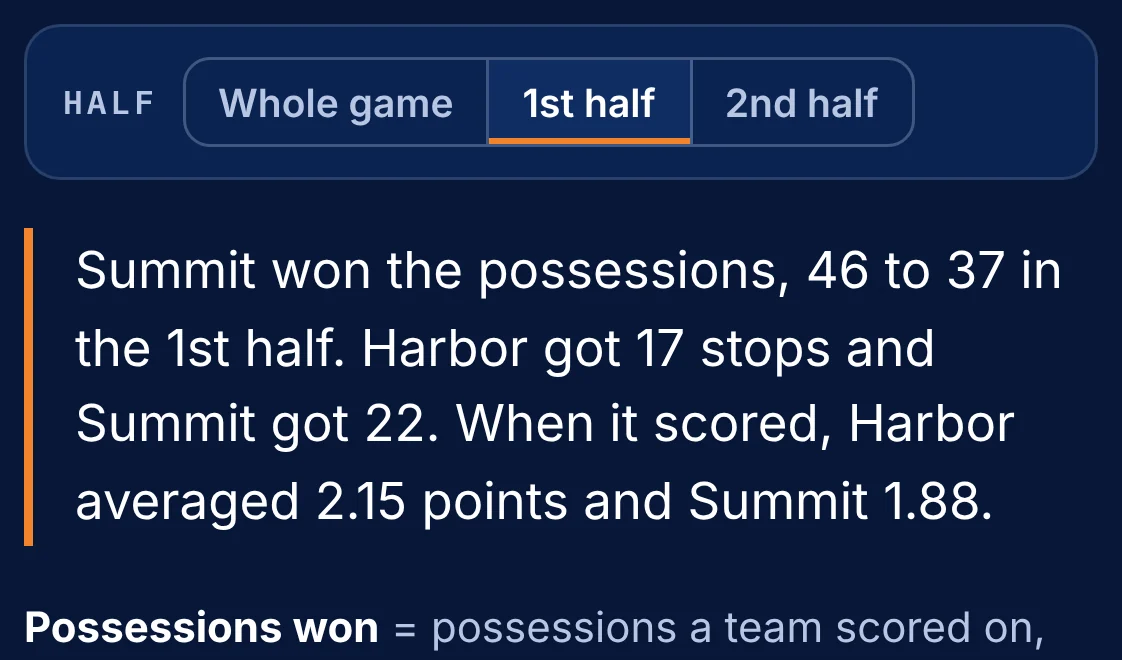
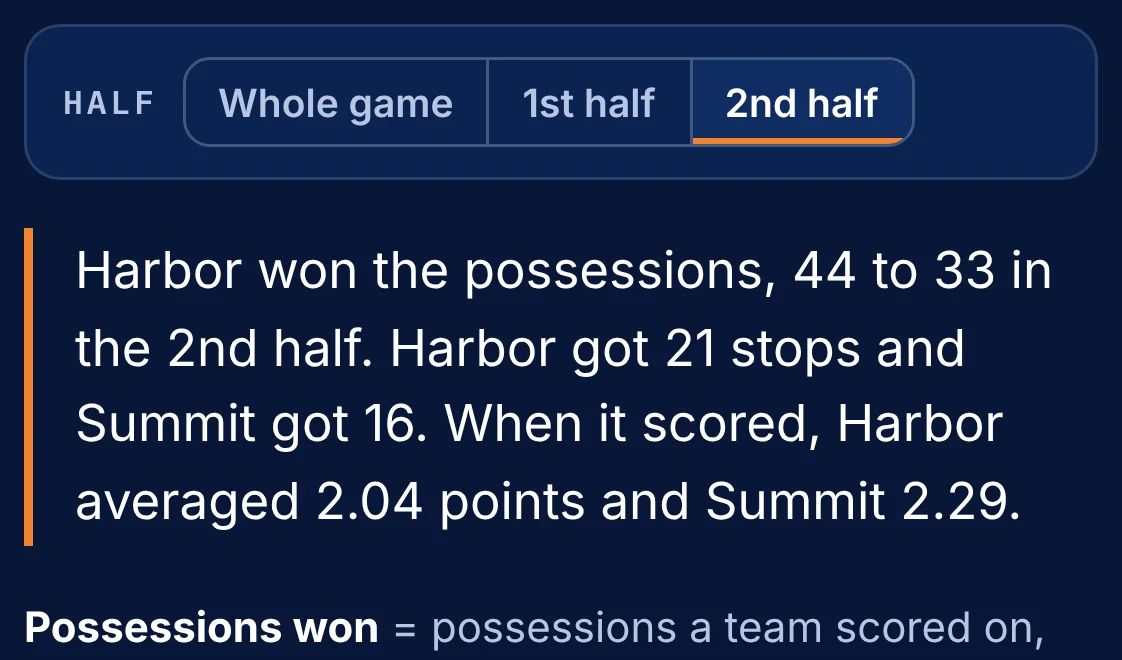
Where the six-point margin came from.
Split by how each team’s possessions started.
After a turnover, Summit was 3 points better; after a missed shot, Harbor +2; after a made basket or free throw, Harbor +3; and Harbor had the ball to start both halves and scored 4 on those two possessions. That is the six. Summit also got 19 more fast-break points; Harbor made 27 of 33 free throws.
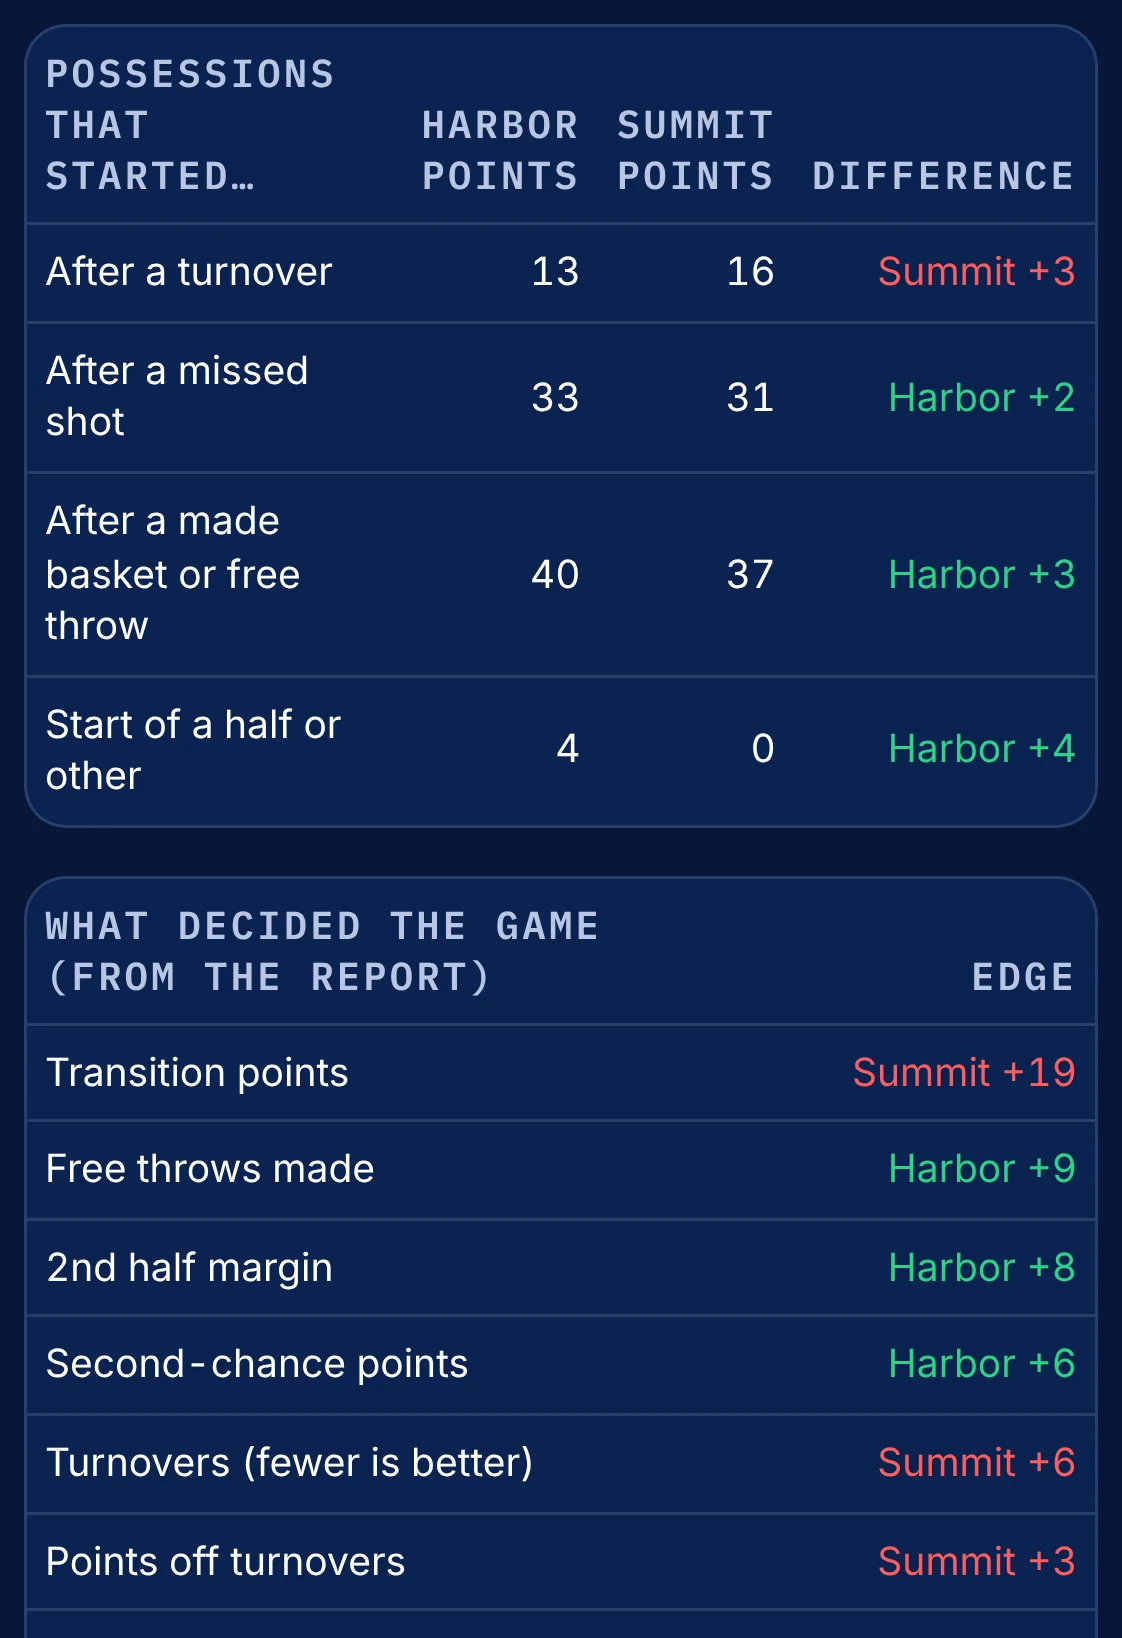
Tap a line, and the possessions behind it open.
Every stop, in order, with the score.
Stops, scoring possessions, turnovers, second chances: each number opens the possessions that make it up.
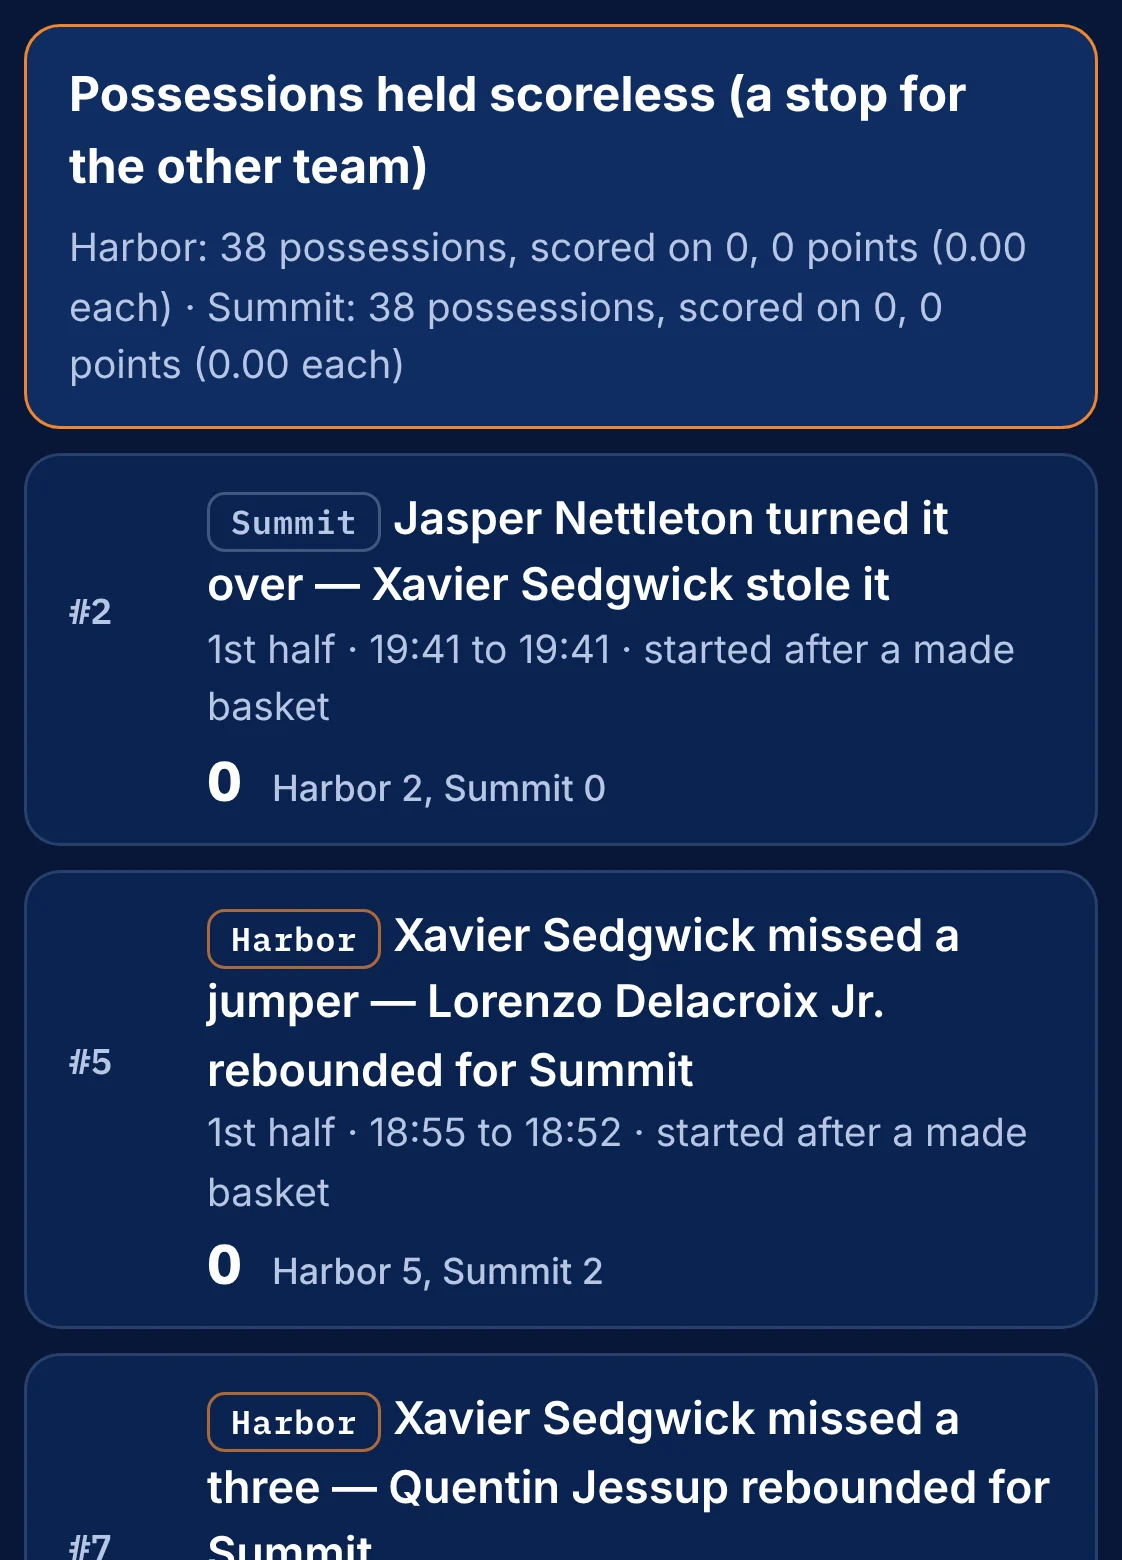
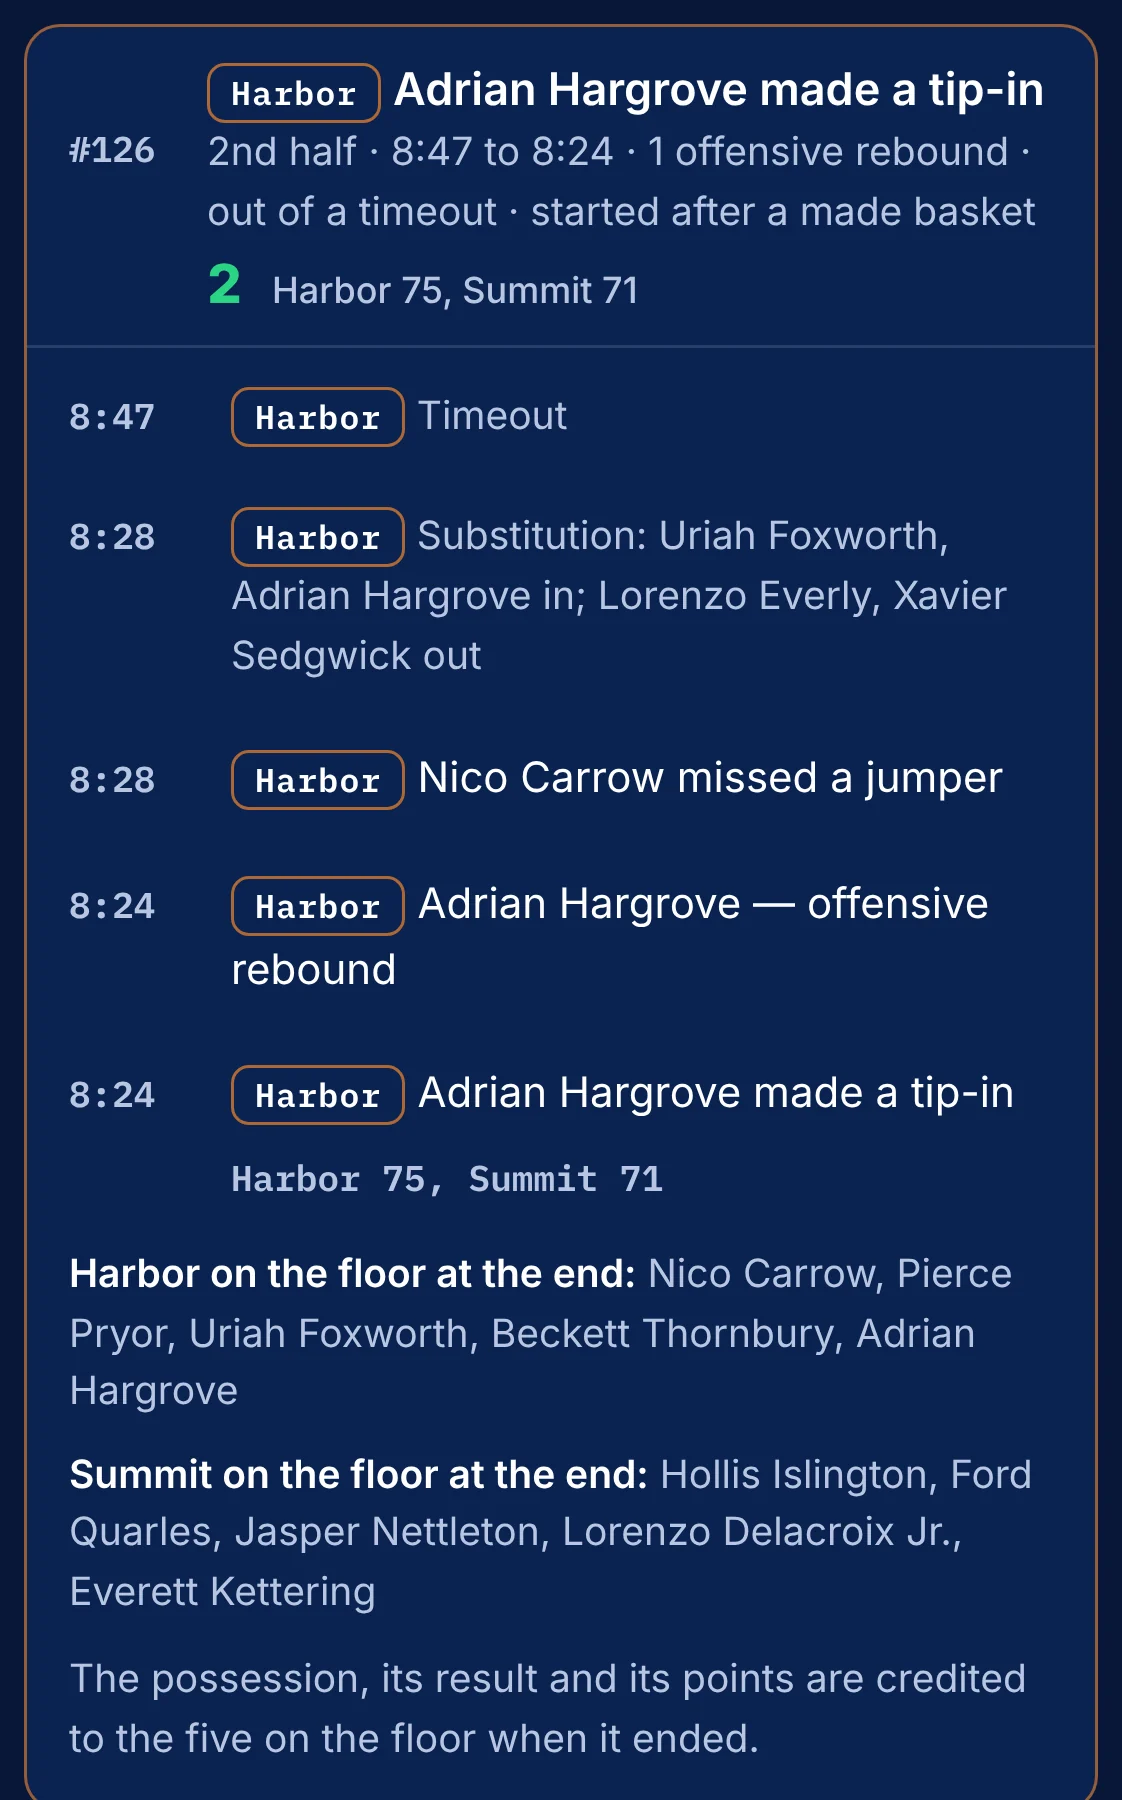
Tap a possession. It reads like the play-by-play.
Who shot, who assisted, who rebounded.
Every substitution, the score after each basket, and the five players on the floor for both teams when it ended.
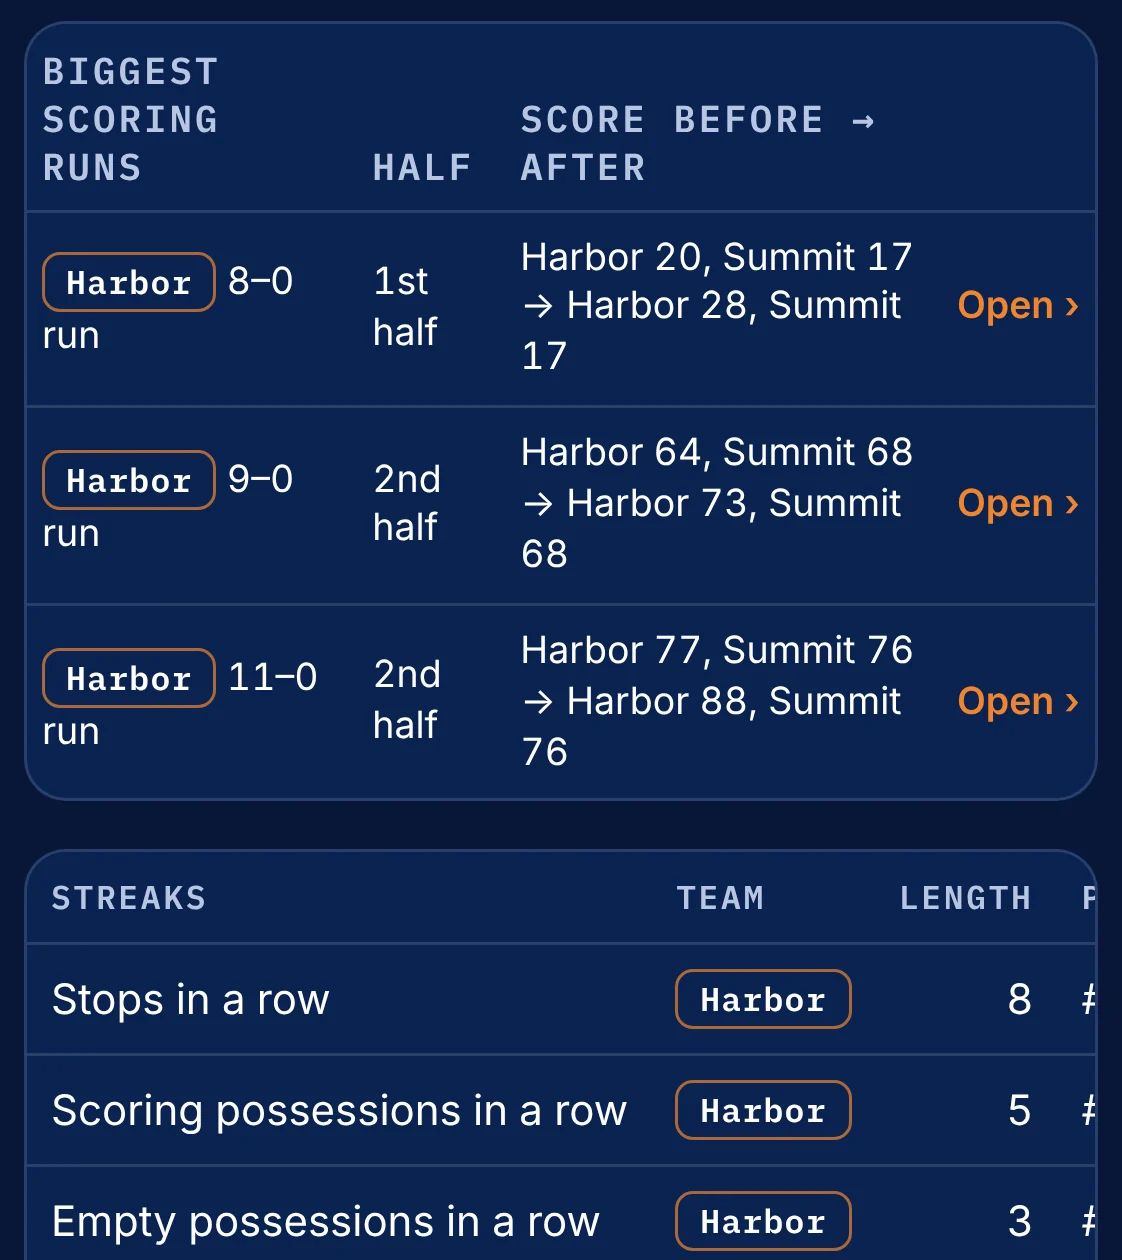
Five-minute stretches. Every run. Tap one to see it.
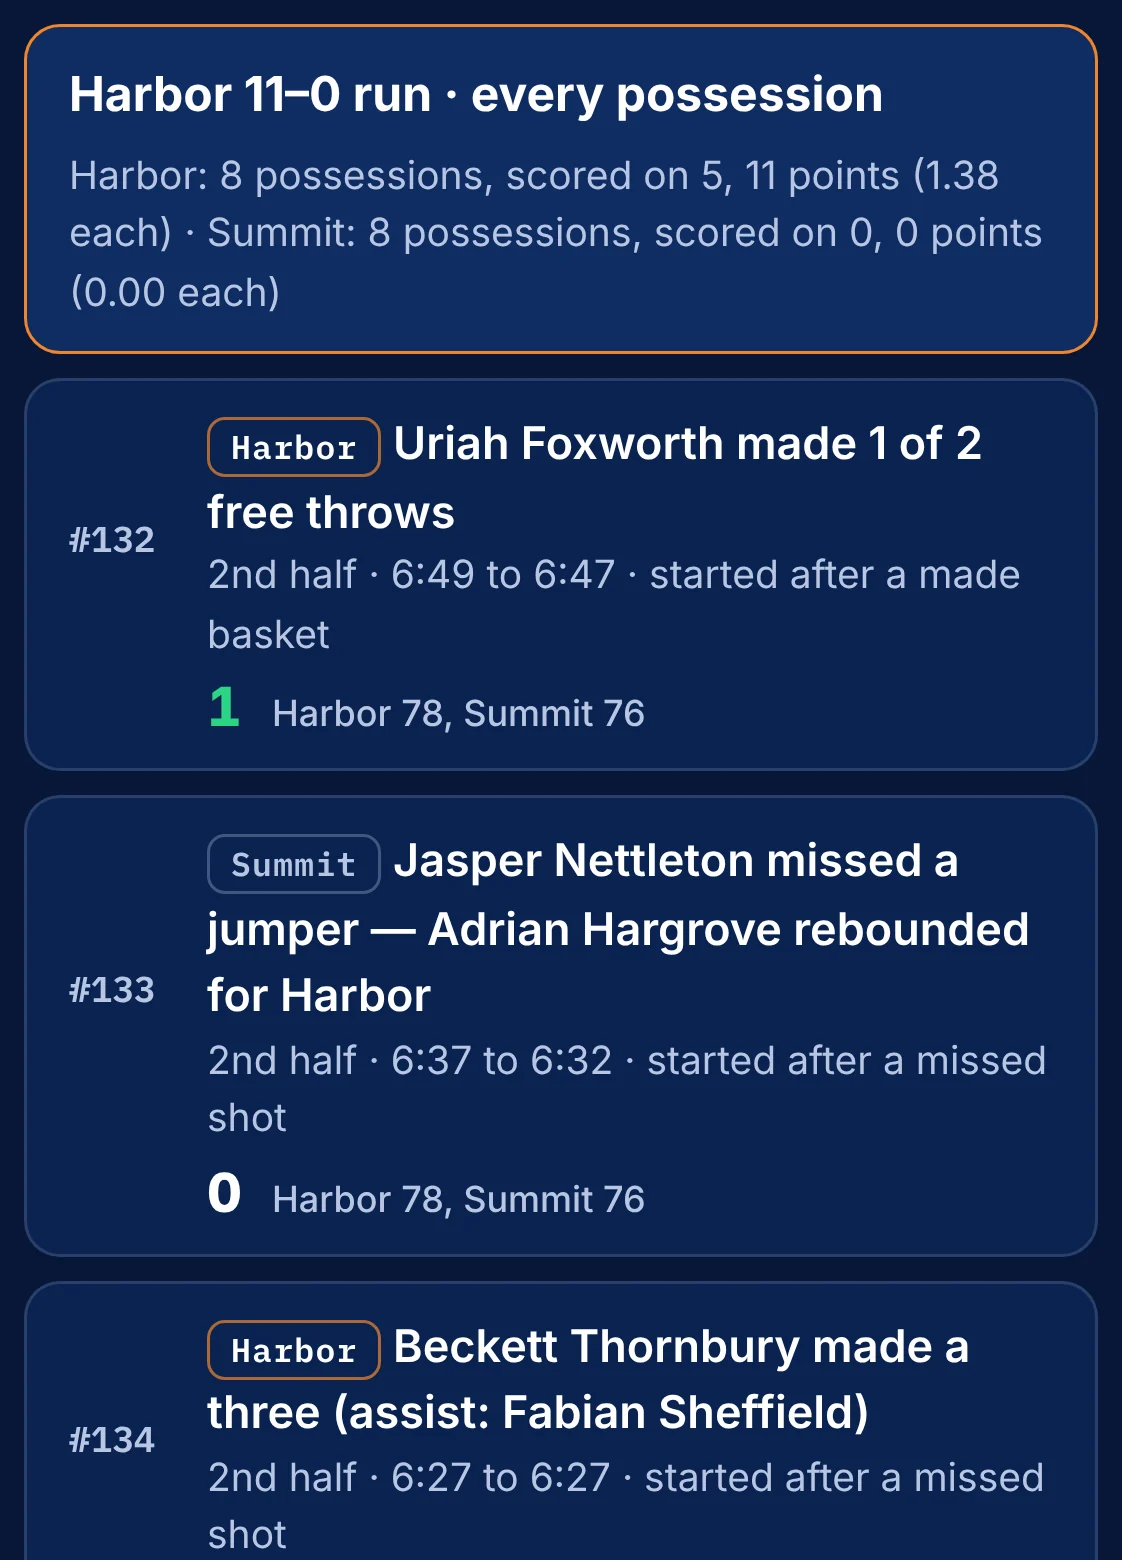
Harbor closed it with an 11–0 run.
From Harbor 77, Summit 76, to Harbor 88, Summit 76, while the Harbor defense got eight stops in a row.
Who kept possessions alive.
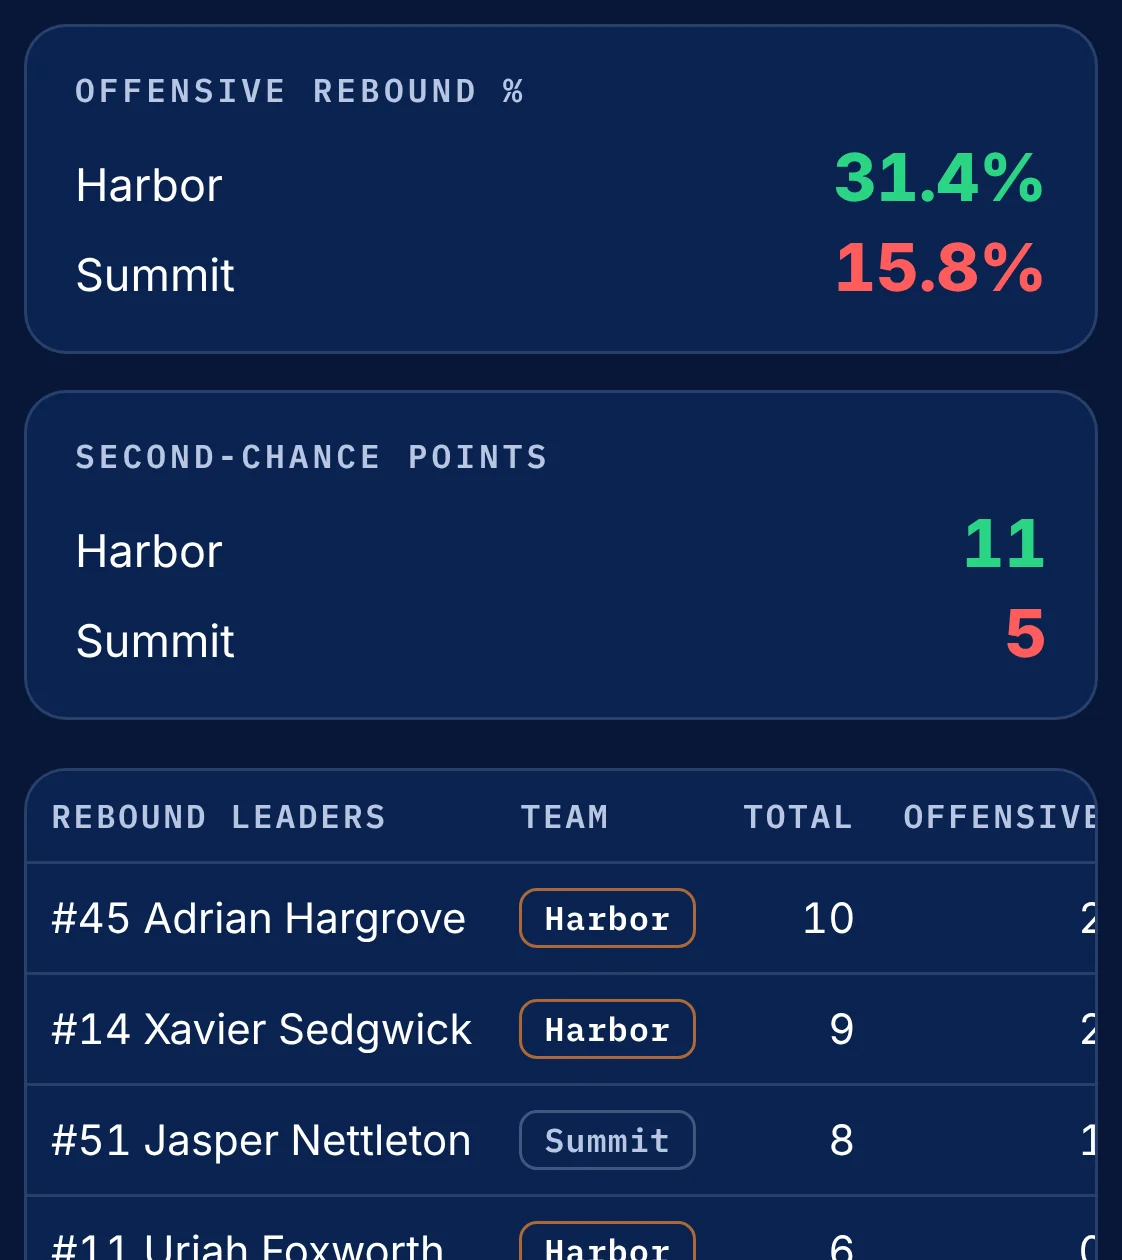
Harbor got back 31.4% of its own misses; Summit 15.8%.
Eleven second-chance points for Harbor, five for Summit. Tap any rebounder, and every possession he rebounded opens.
Every player, ranked by PBiR.
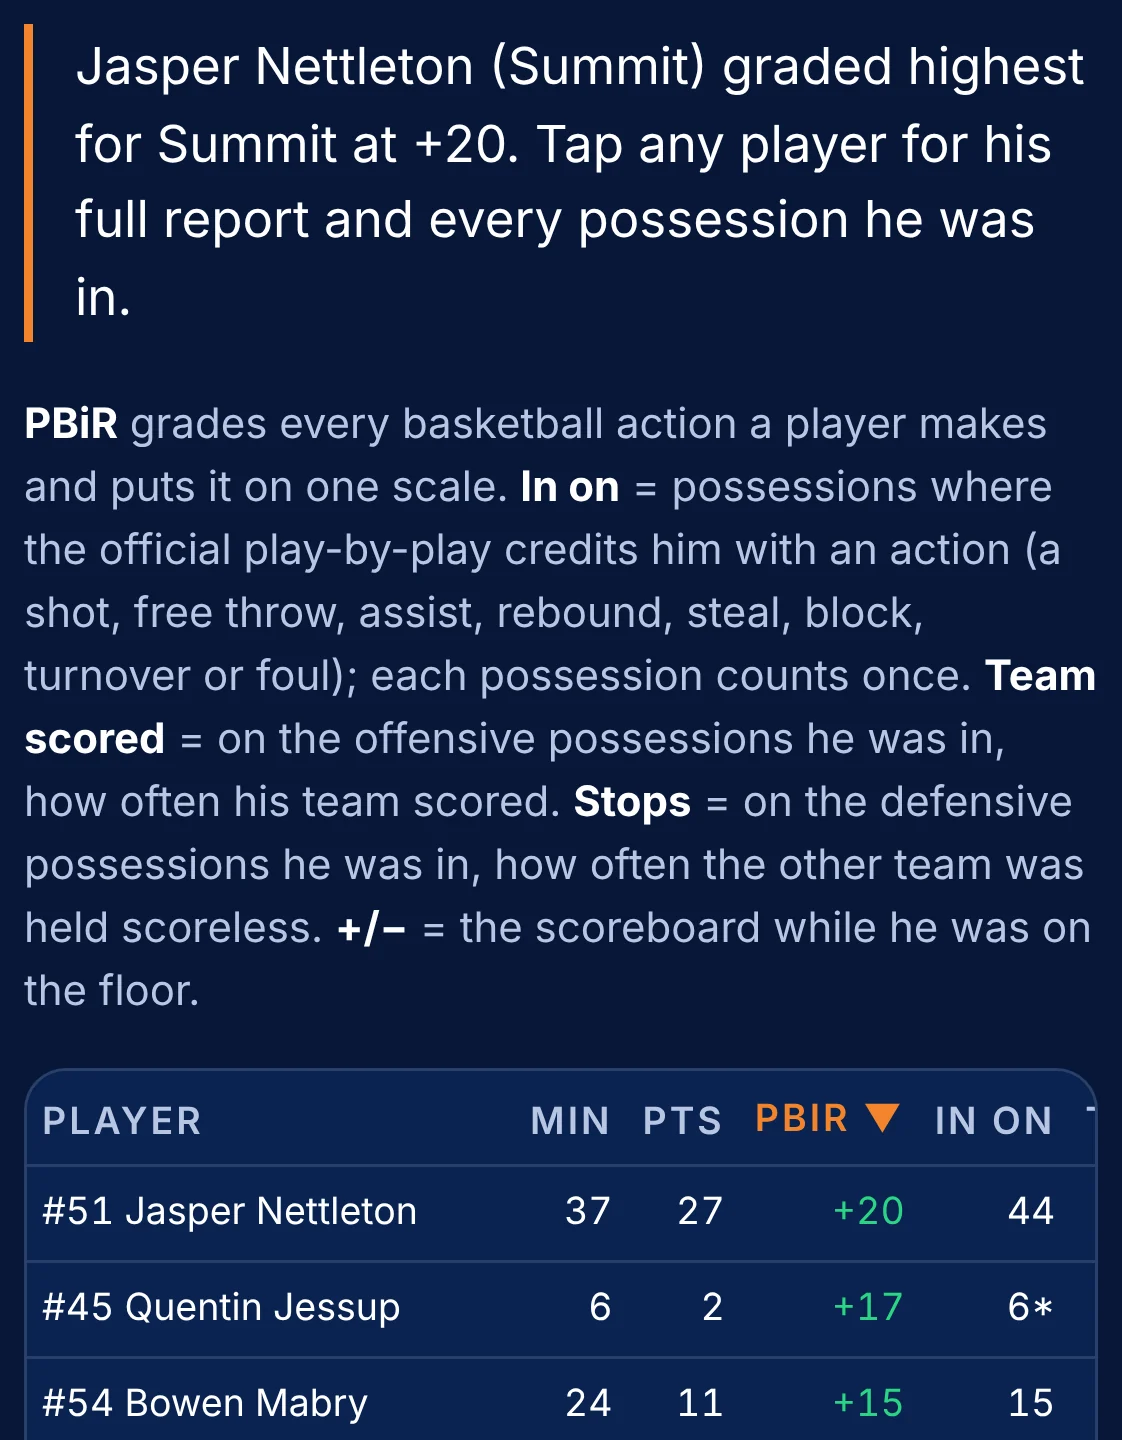
PBiR grades every basketball action a player makes and puts it on one scale.
Adrian Hargrove led the game at +44, with 28 points.
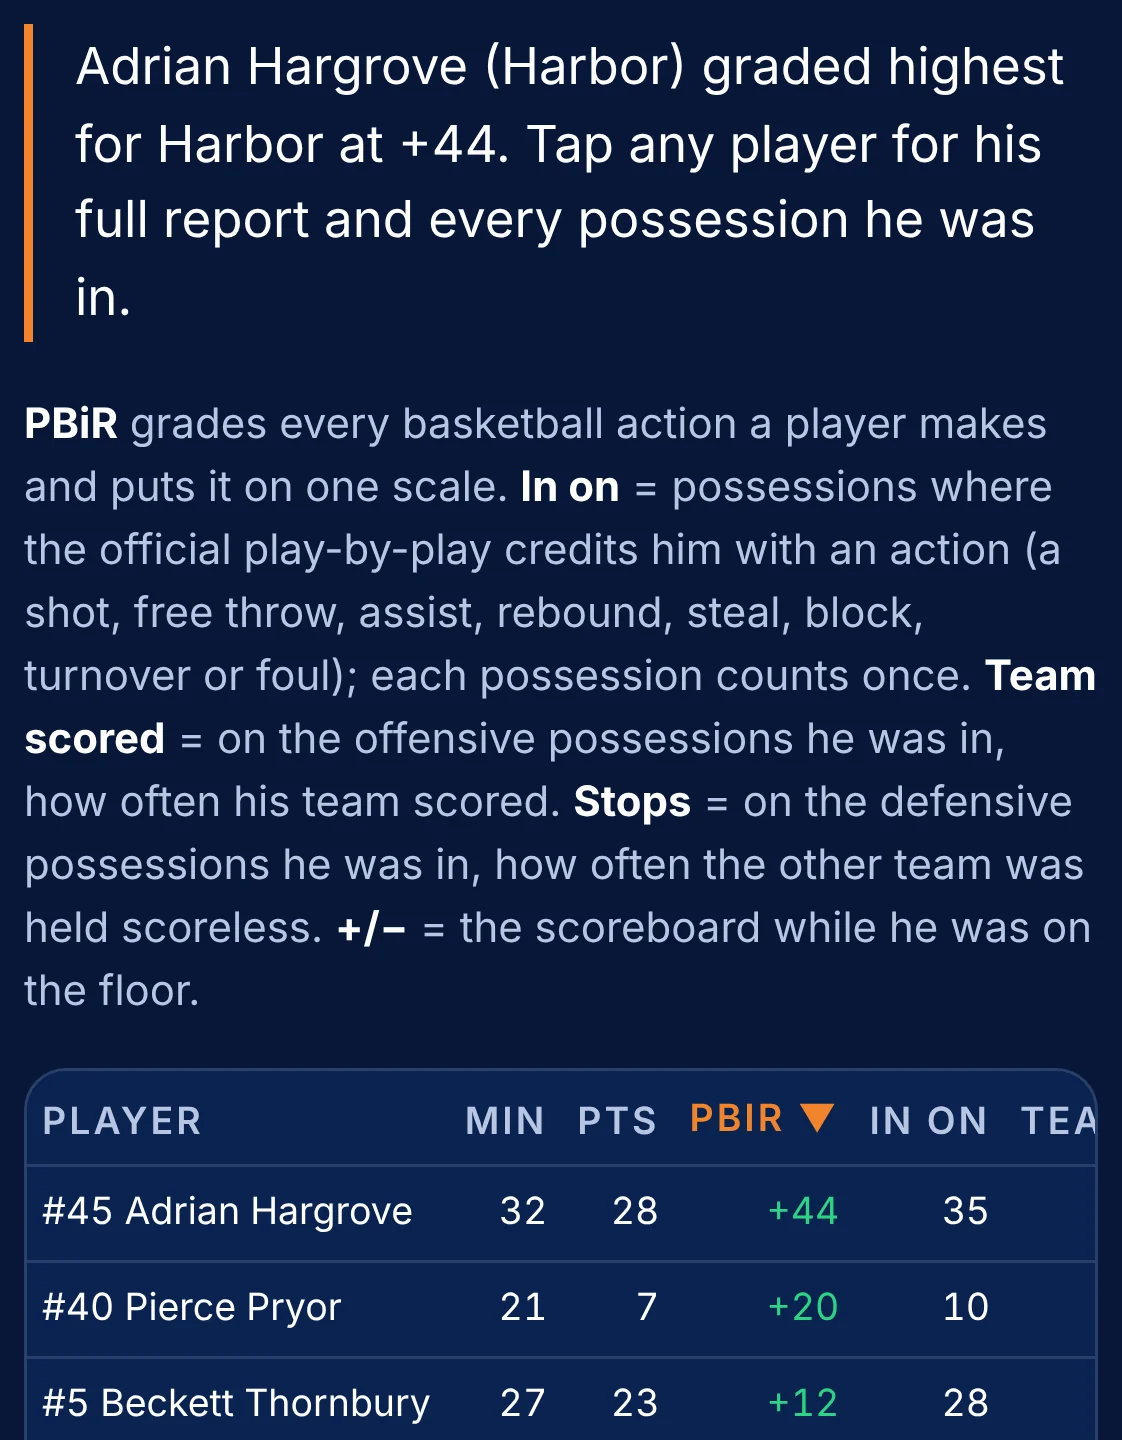
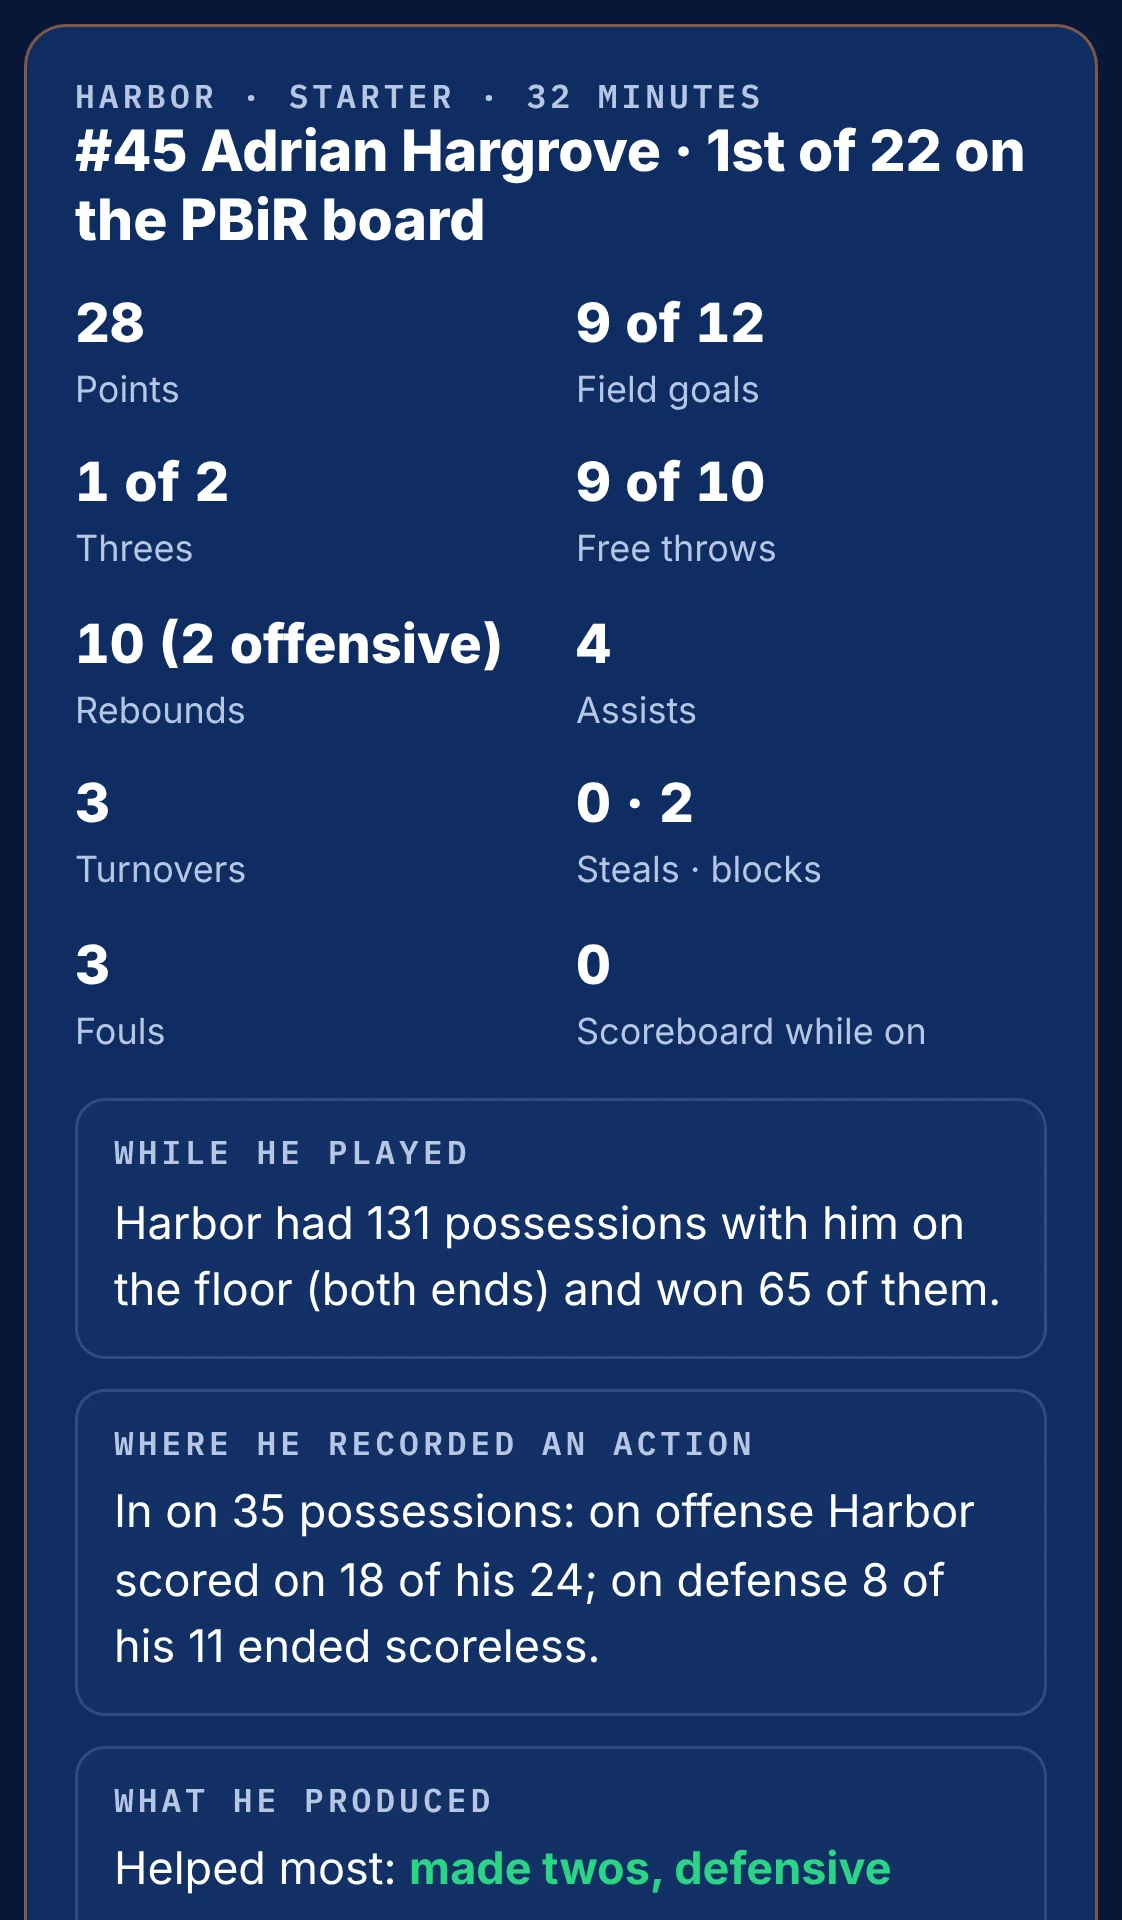
Tap a player. His own report opens.
His line, his possessions, what helped and hurt him most.
How his team did with him on the floor, every possession he was in on, and one more tap opens all of them.
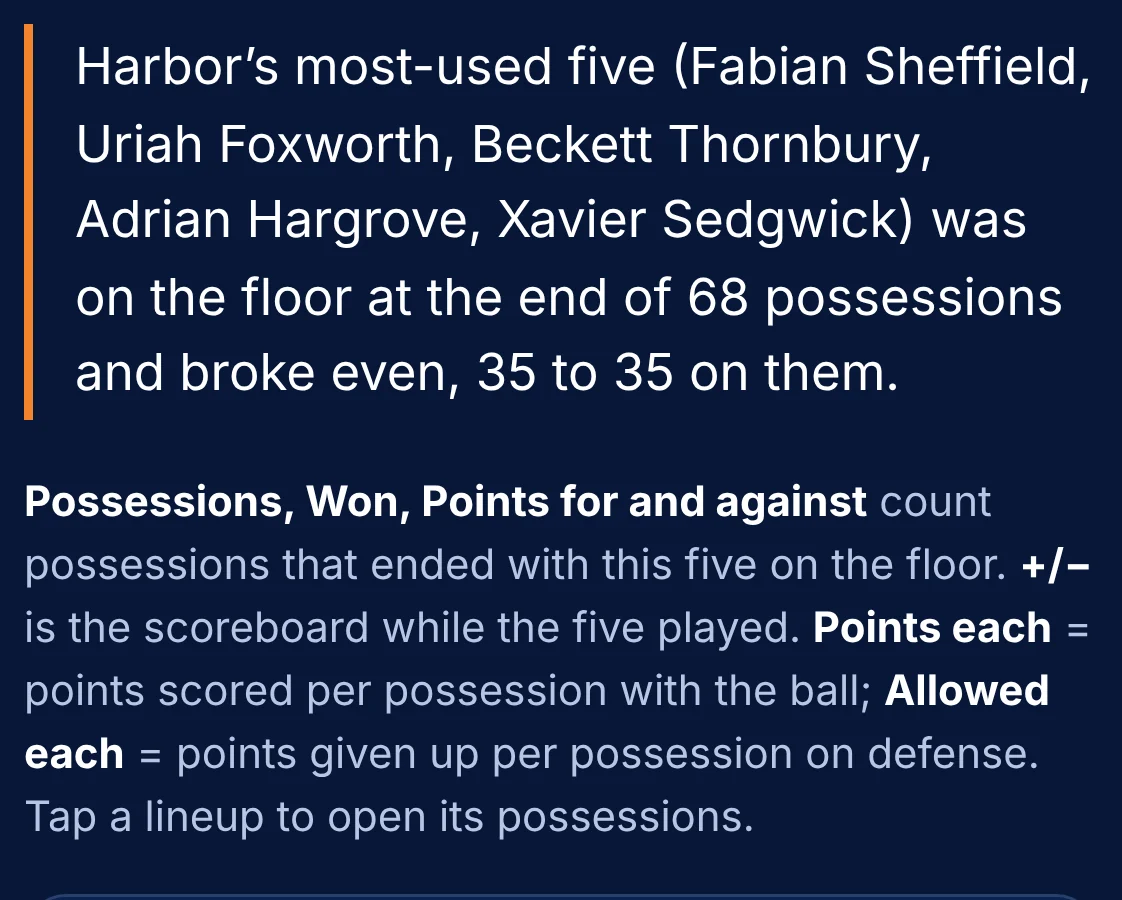
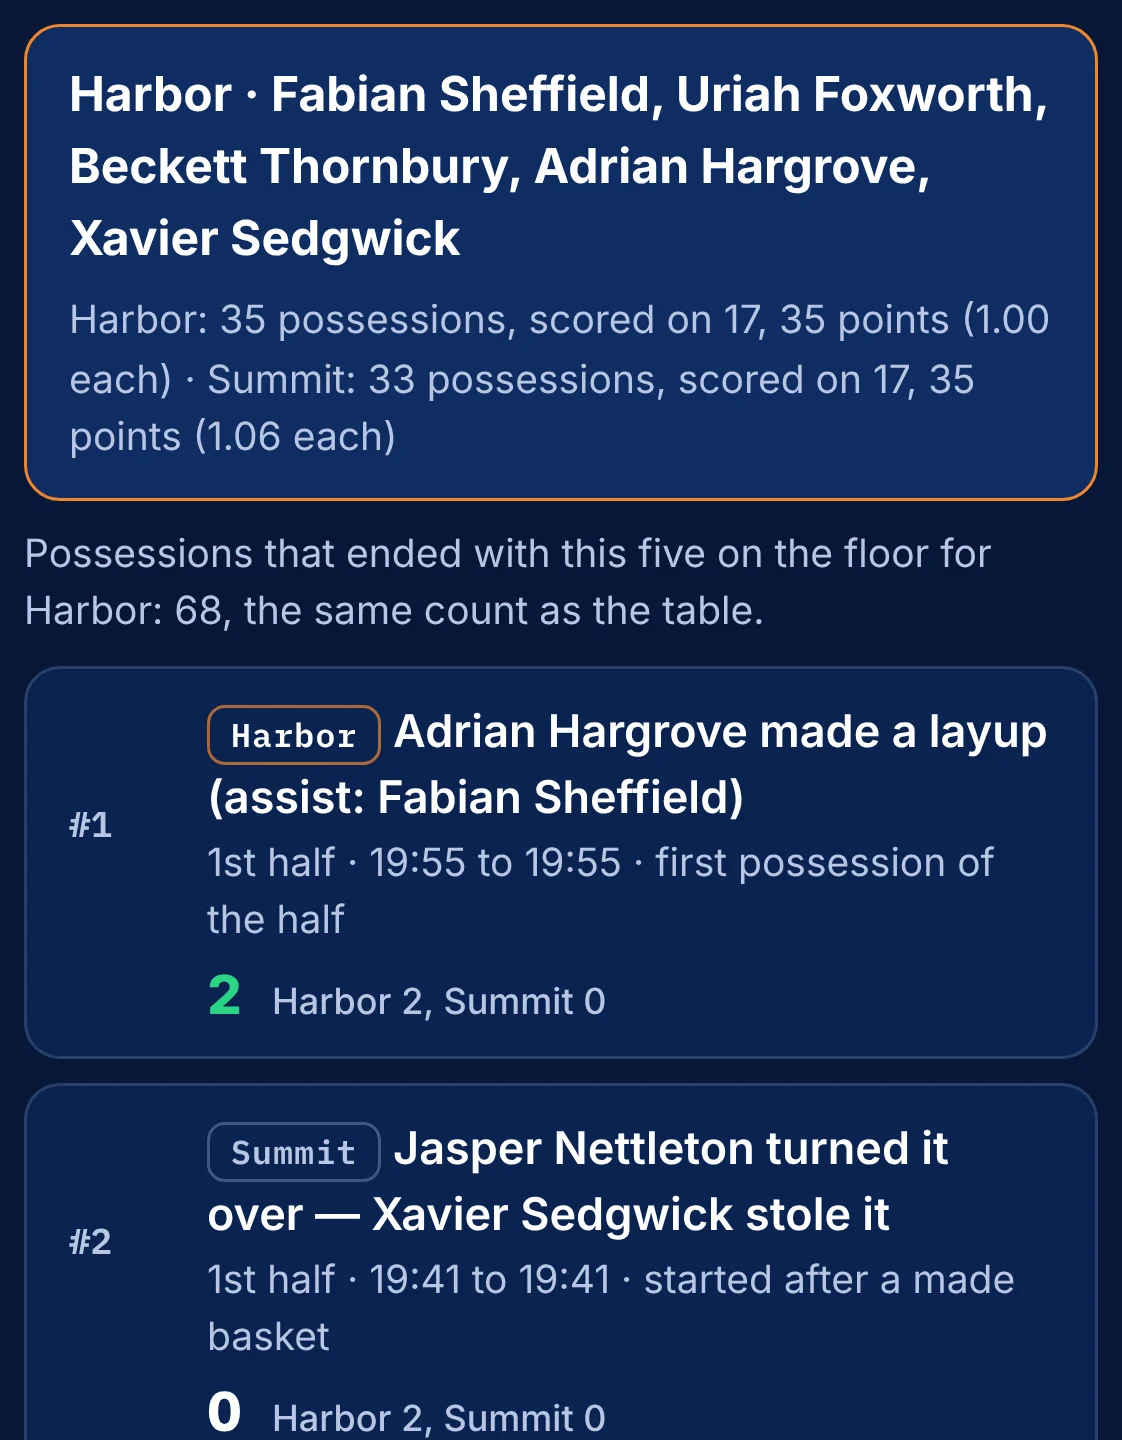
Every five that played, and the score on its possessions.
Tap a lineup for the exact possessions.
Harbor’s most-used five finished 68 possessions and broke even, 35 to 35.
The other team gets a part of its own.
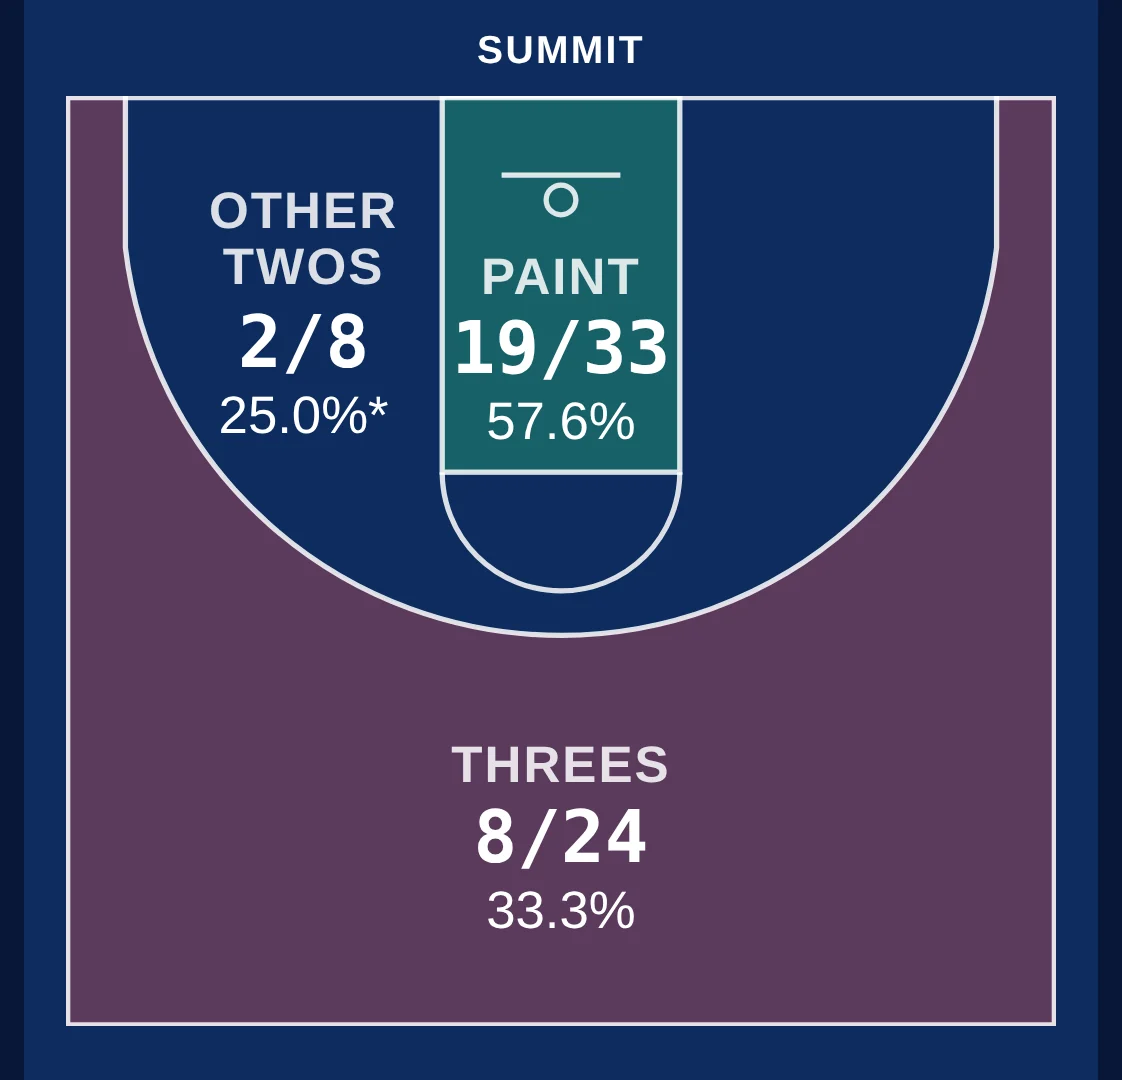
Its board, its players, its lineups, its shot profile.
Jasper Nettleton led Summit with 27 points and a PBiR of +20. Summit made 8 of 24 threes.
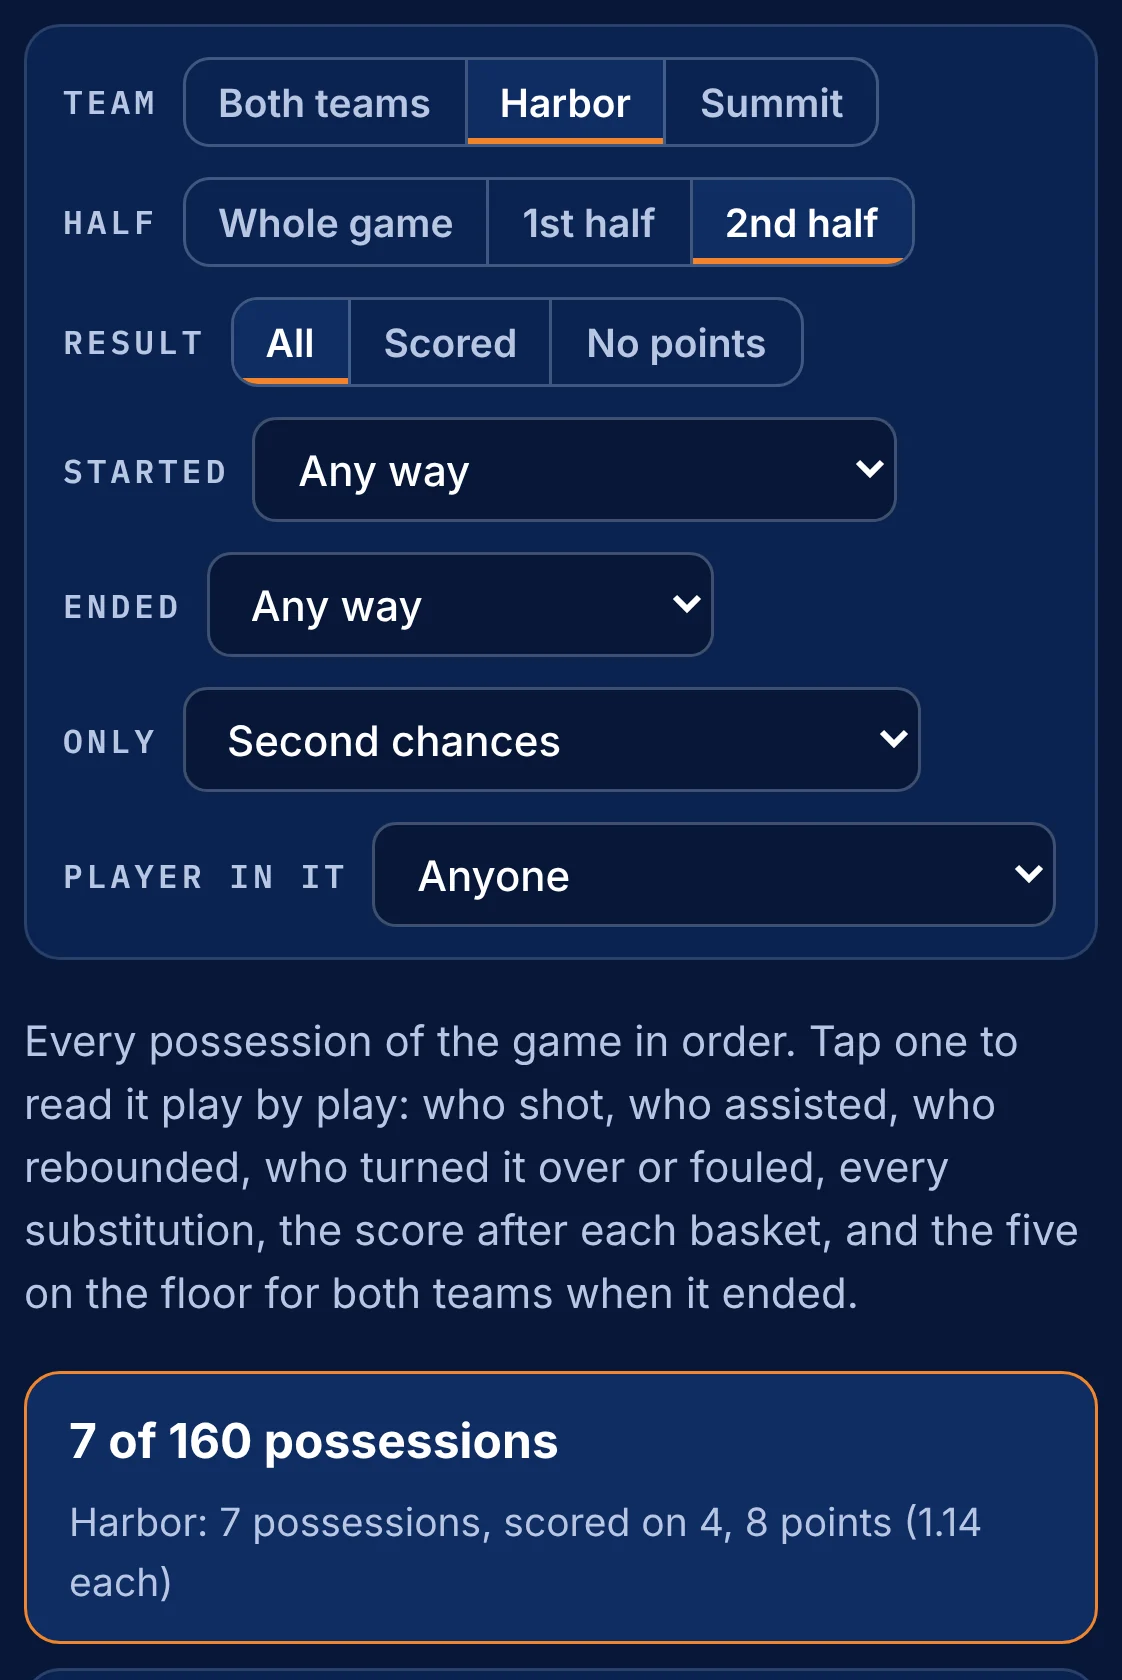
Every possession, filtered your way.
Team, half, start, end, second chances, one player.
Pick the filters, and the list rebuilds itself.
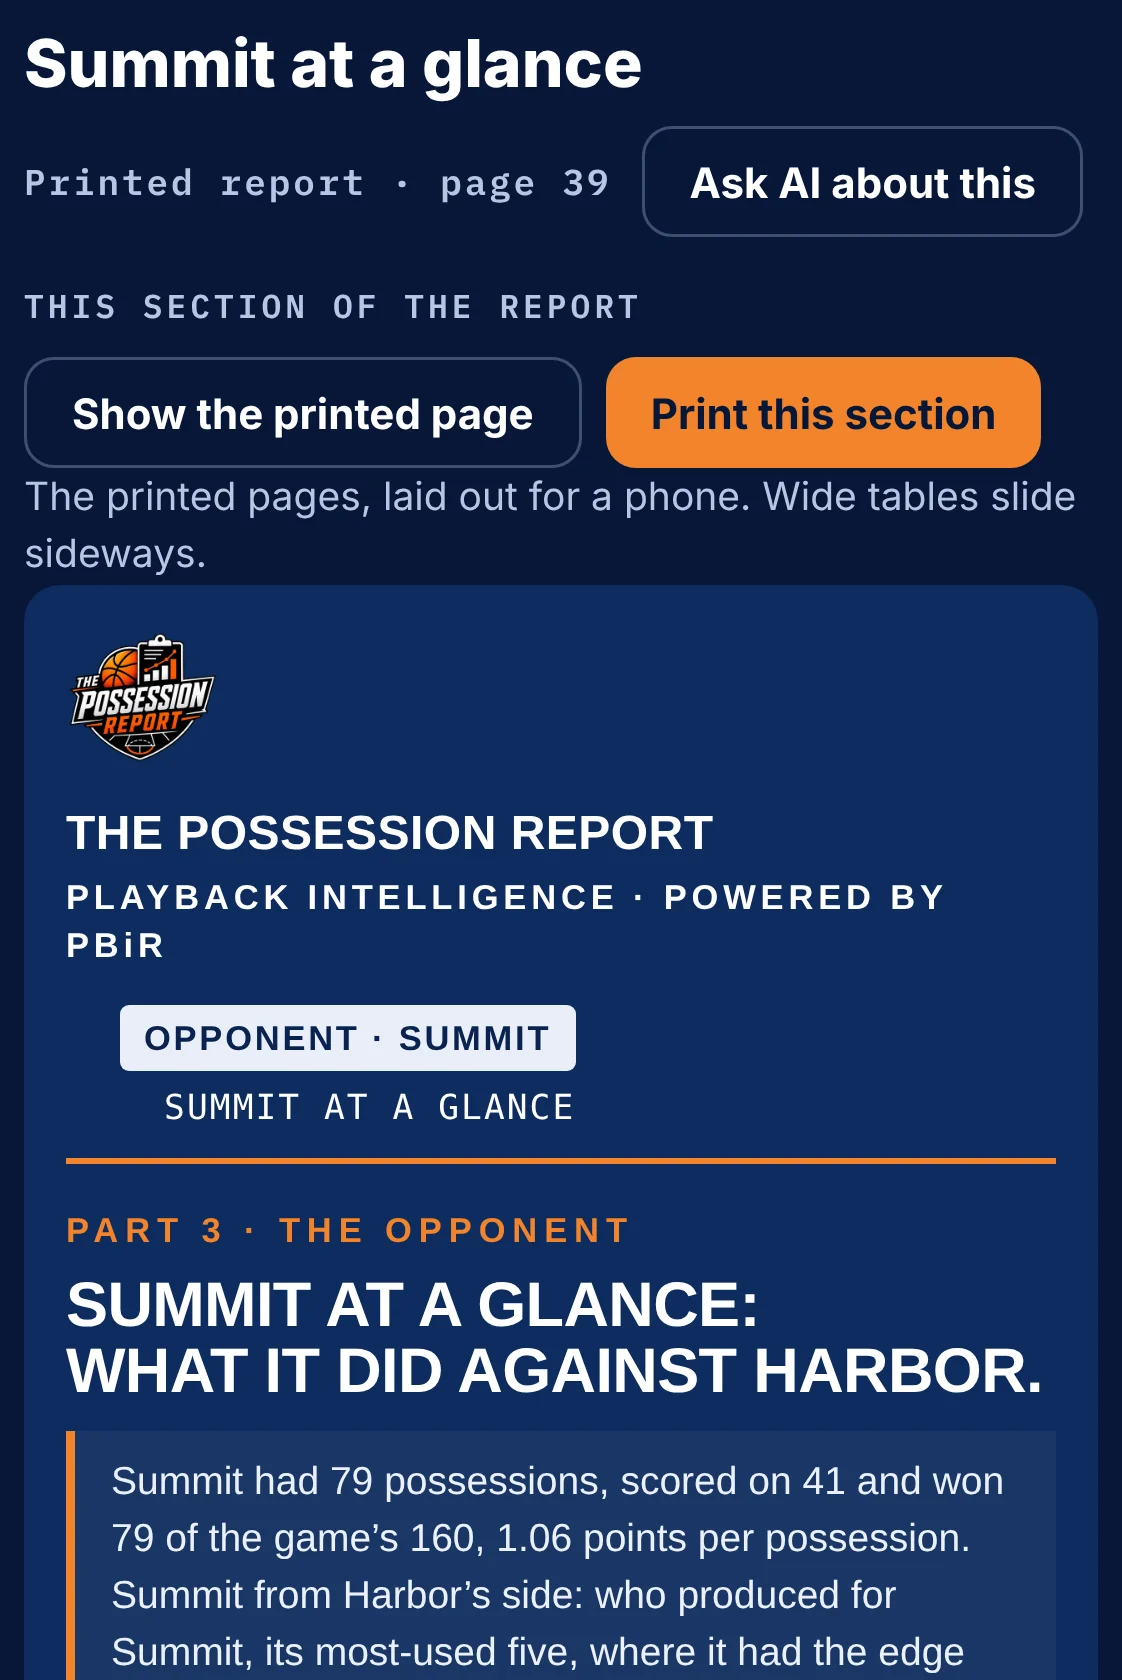
The printed pages are under every section.
Print just the section you need.
The same pages a coach hands to his staff. On a phone, they lay themselves out to fit the screen.
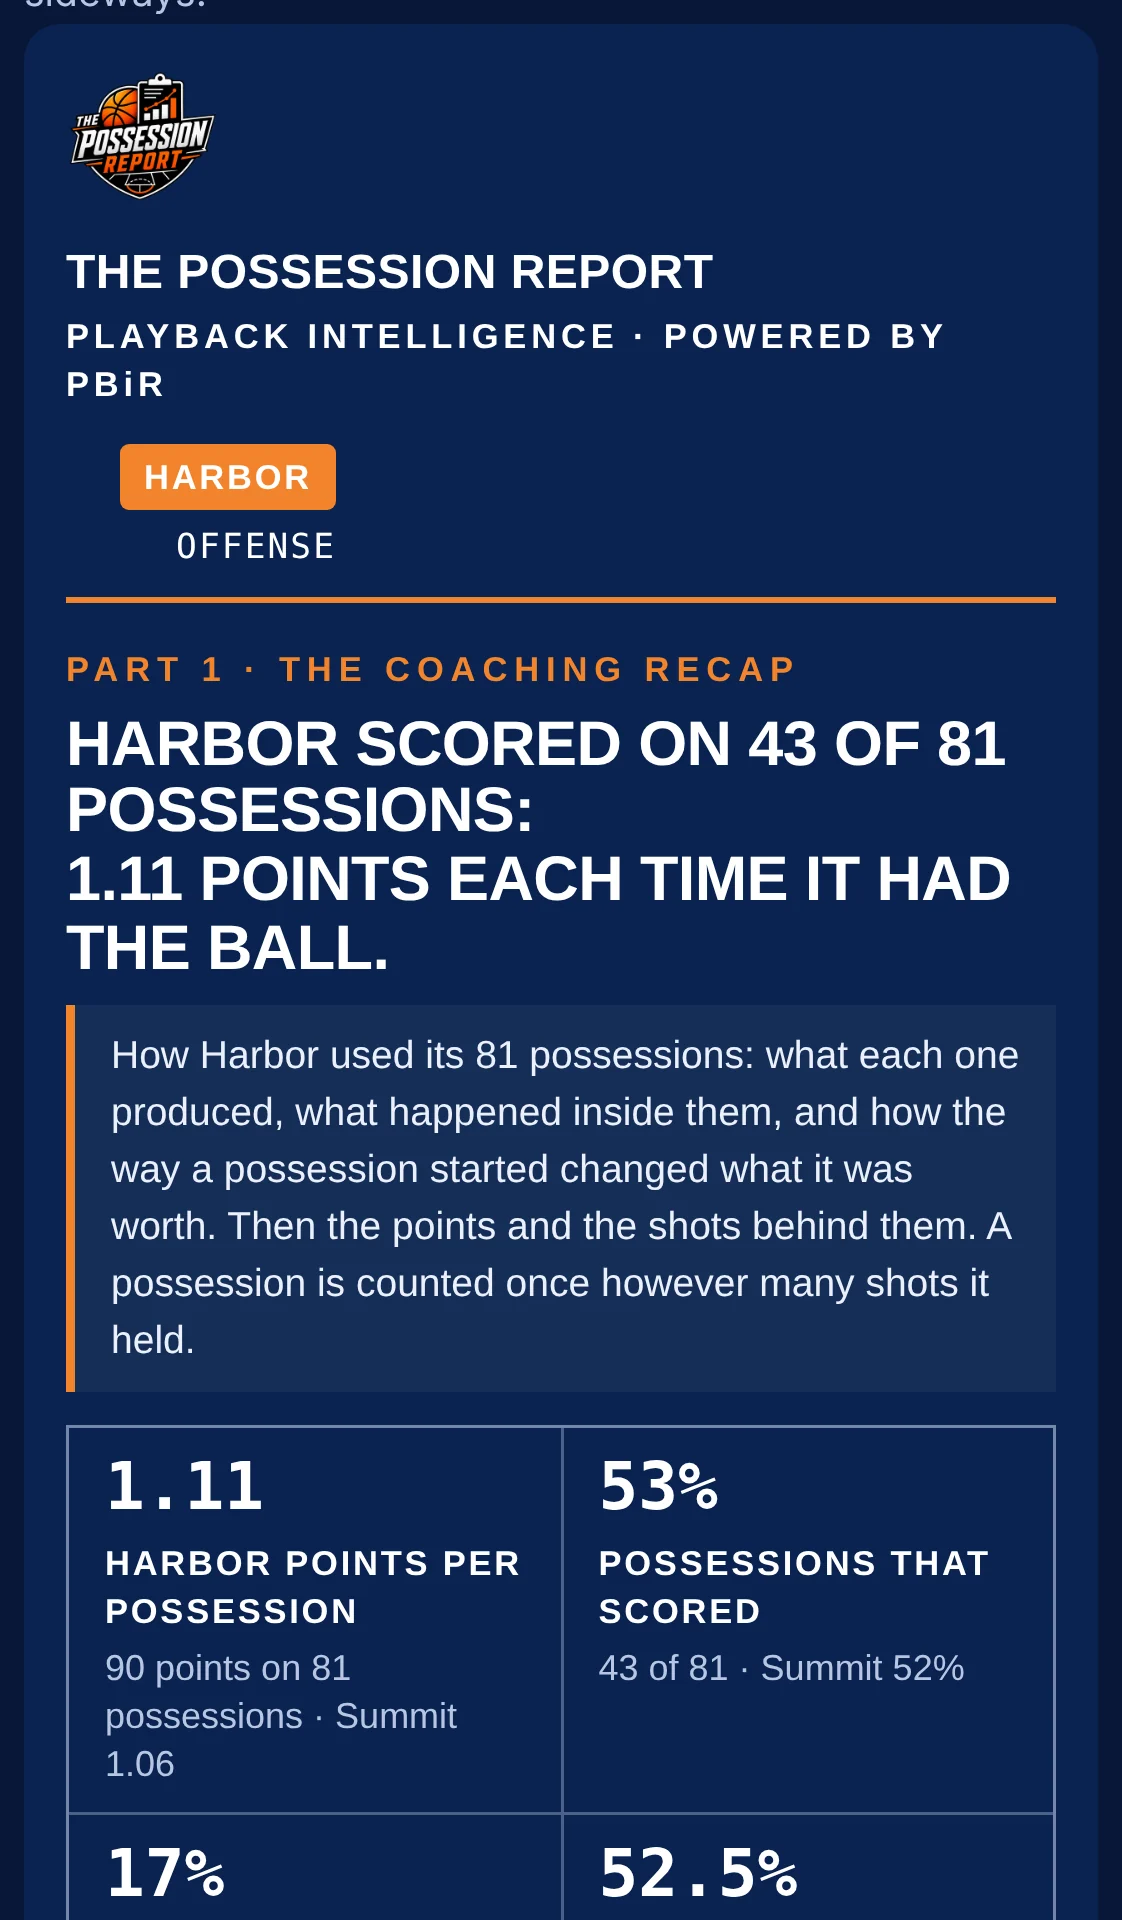
The game, turned into a plan.
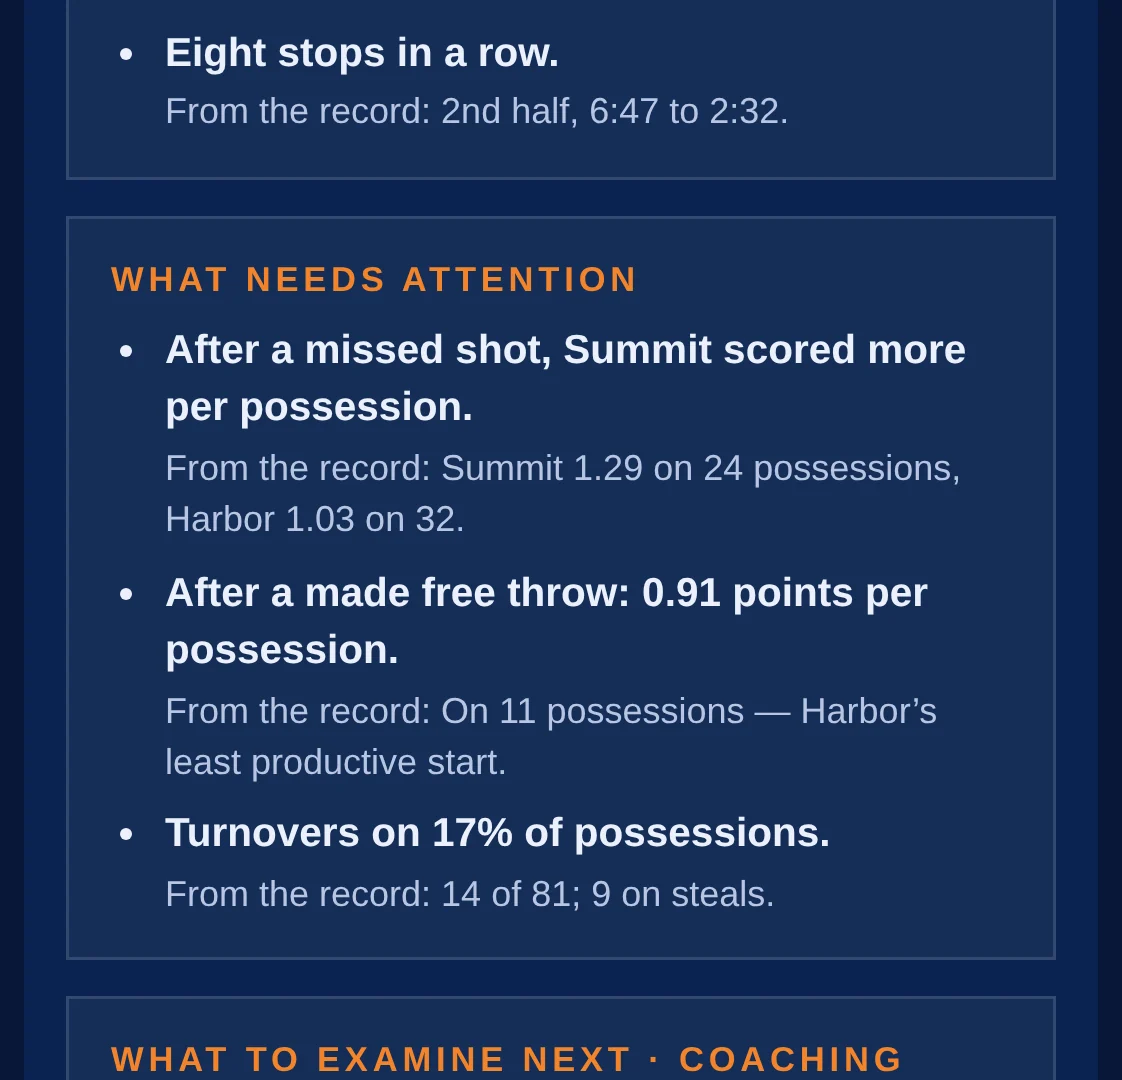
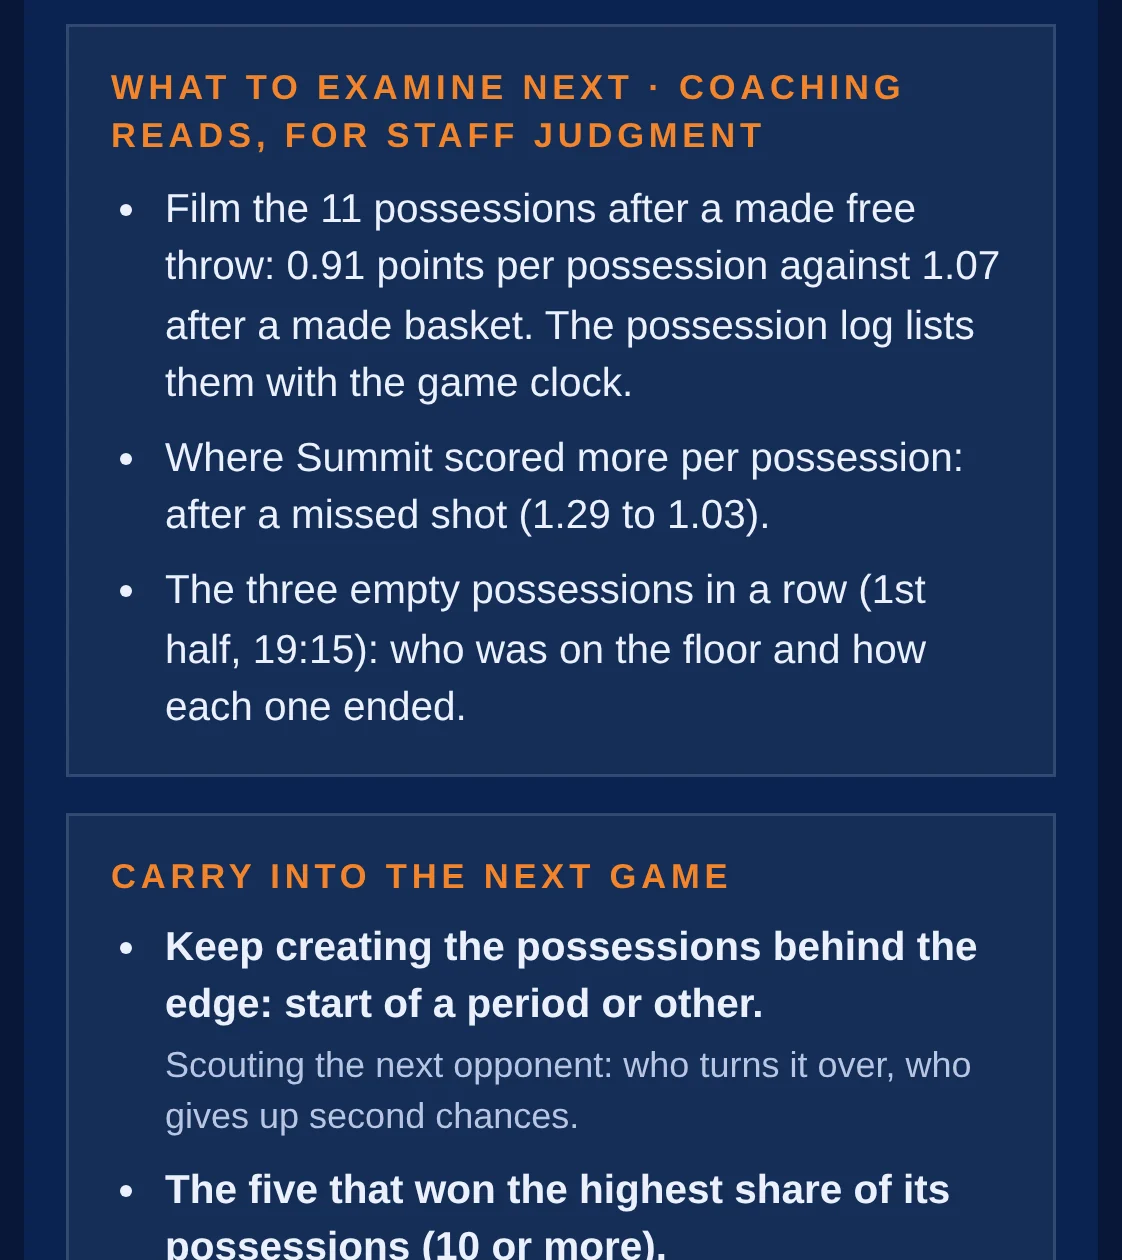
What worked. What needs attention. What to look at next.
Eight stops in a row late in the second half. Turnovers on 17% of Harbor’s possessions. The 11 possessions after a made free throw, listed with the game clock for film.
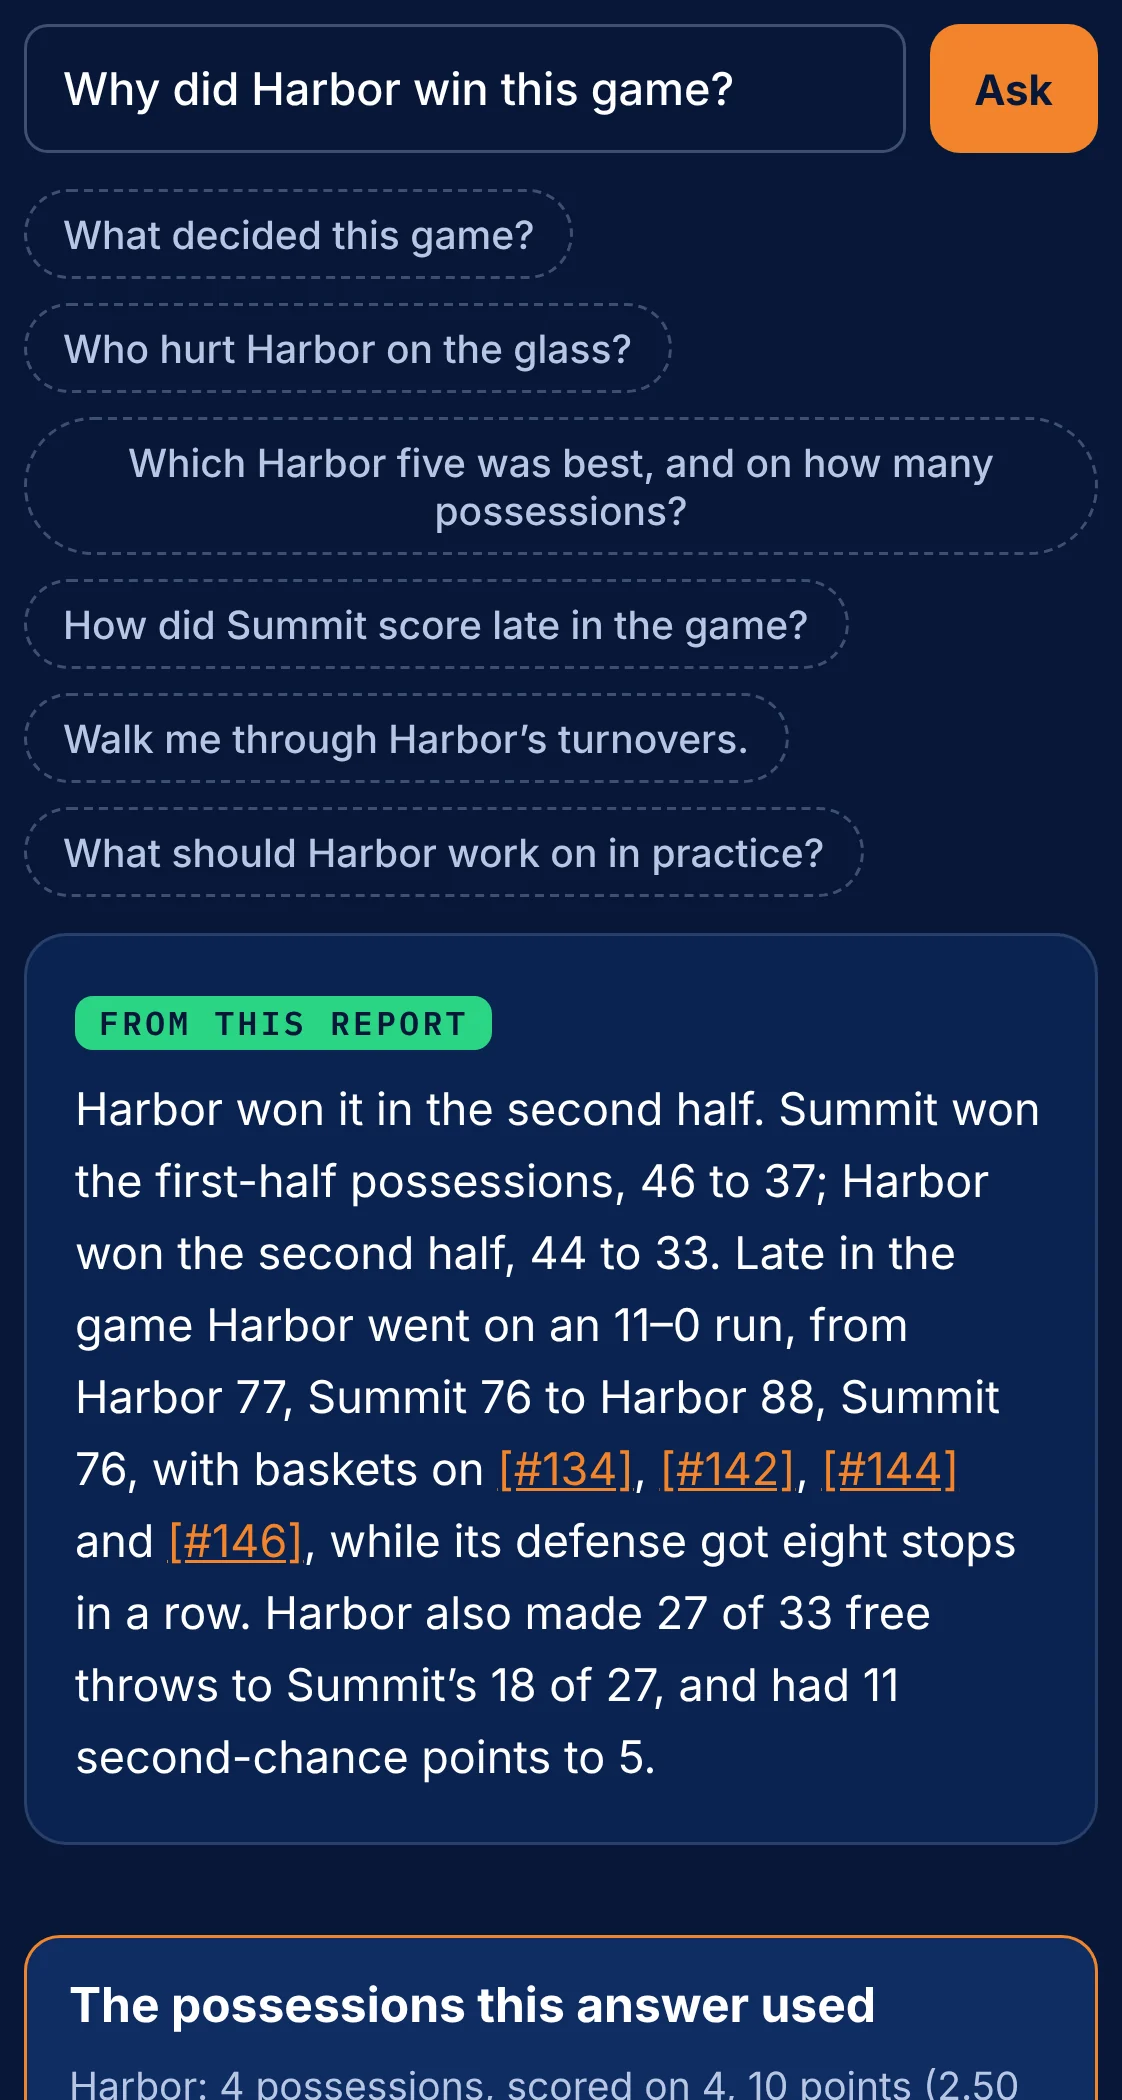
Ask a question. Get the answer from the report.
Then open the exact possessions it used.
Ask why Harbor won, and Ask AI answers in plain words, from this game’s report, with every possession it relied on one tap away.
Every game. Every possession. Every player.
The interactive Game Recap from The Possession Report.
Playback Intelligence, powered by PBiR.